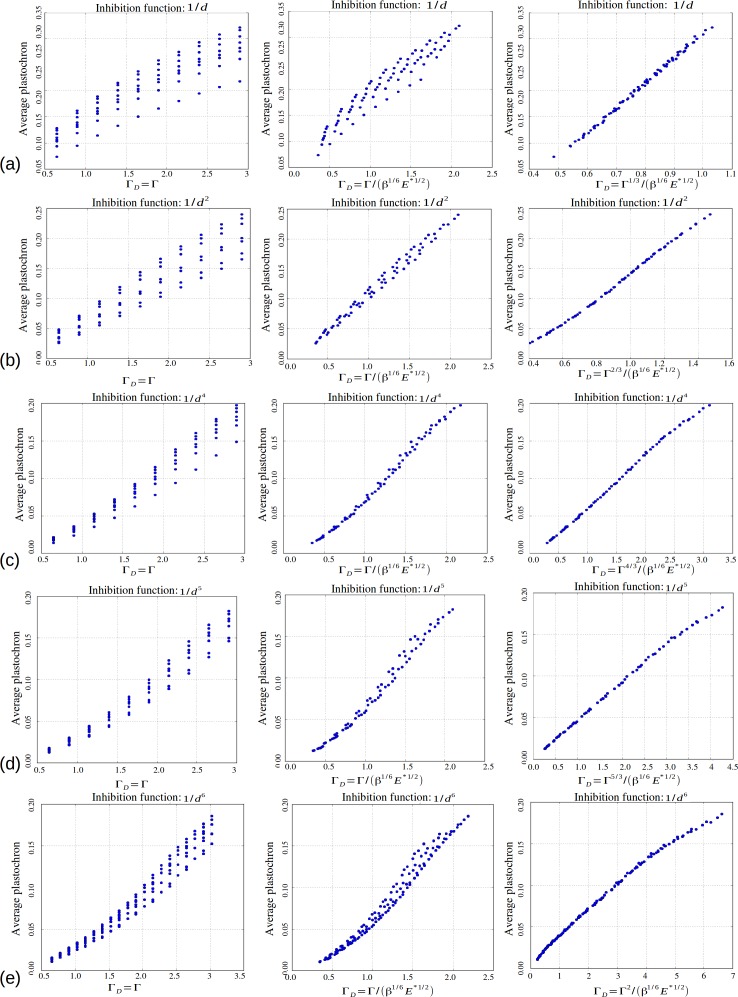
Appendix 1—figure 6. Role of the control parameters for the power law inhibition function, with rows (a–e) corresponding respectively to a steepness .
First two columns: average plastochron ratio as a function of and , respectively. Third column: average plastochron ratio as a function of .

