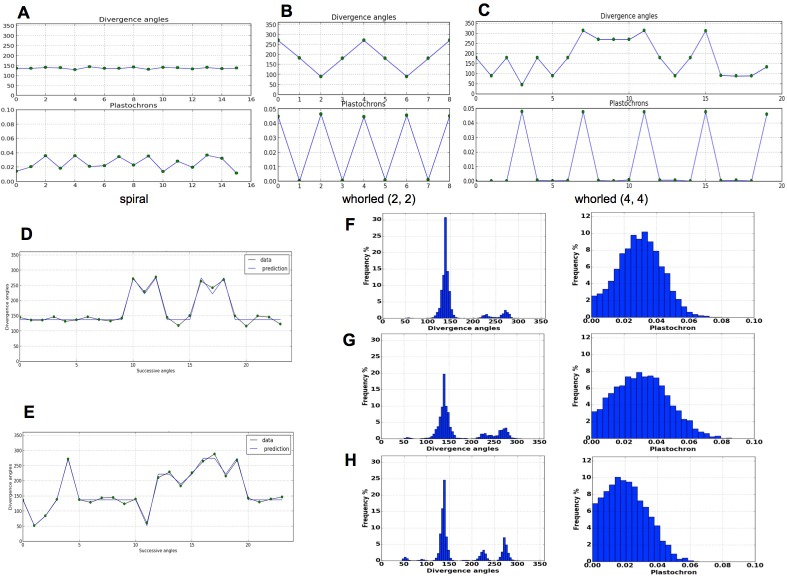
Figure 4. Patterns generated by the stochastic model. .
(A) The model generates spiral patterns (in (A–C), up: sequence of simulated divergence angles, down: corresponding plastochrons). (B–C) and whorled patterns. (D) Simple M-shaped permutations simulated by the stochastic model ( = 10.0, = 1.4, = 0.625). (E) More complex simulated permutations involving 2- and 3-permutations ( = 10.0, = 1.4, = 0.9). The permutations are here: [4, 2, 3], [14, 13, 12], [16, 15], [19, 18]. (F) Typical histogram of simulated divergence angles and corresponding plastochron distribution for = 11.0, =1.2, = 0.8. (G) Histogram of simulated divergence angles and corresponding plastochron distribution for = 9.0, = 1.2, = 0.8 (H) Histogram of simulated divergence angles and corresponding plastochron distribution for = 9.0, = 1.2, = 0.625.

