. 2016 Jul 6;5:e14093. doi: 10.7554/eLife.14093

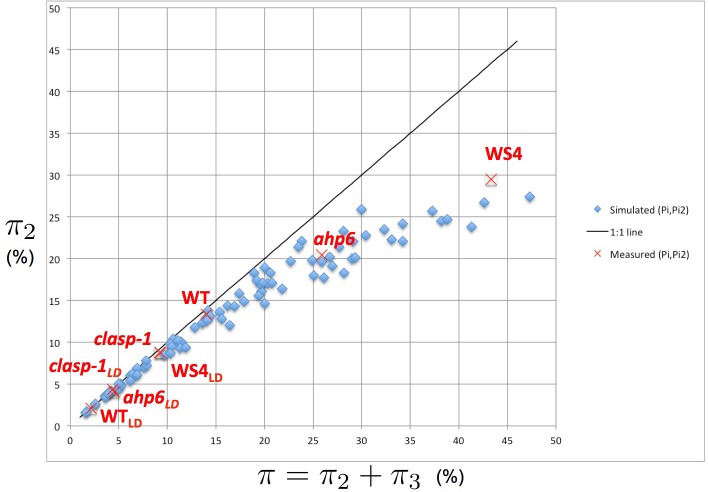
Figure 5. Intensity of 2-permutations as a function of the total amount of perturbations.

Figure 5.

As the perturbation intensity π increases, the percentage of 2-permutations decreases in a non-linear way to the benefit of more complex 3-permutations. The diagonal line denotes the first bisector. In red: values of 2- and 3-permutations observed in different mutants and ecotypes of Arabidopsis thaliana (Besnard et al., 2014; Landrein et al., 2015 and this study) placed on the plot of values predicted by the stochastic model.

DOI: http://dx.doi.org/10.7554/eLife.14093.011

Figure 5—source data 1. Source files for simulated permutation intensities.
This file contains a table showing the variation of permutation intensities with model parameters. We ran simulations using the SMPmacro-max model for different parameter values where the local minima of inhibition profile indicate the potential initiation sites (for this, the inhibitory field values were estimated at 360 sampling points regularly distributed around the periphery of the central zone). We then used the combinatorial model (Refahi et al., 2011) to detect permutations in the simulated sequences. The model has mainly three parameters, β, E and Γ. For each parameter value of β, E and Γ, we run sixty simulations. Each simulation generated a sequence of 25 divergence angles. We then analyzed the sequences using the combinatorial model to detect permutation patterns.
DOI: 10.7554/eLife.14093.012