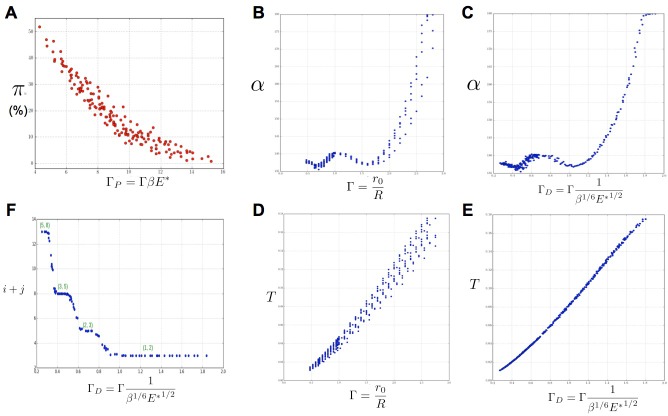
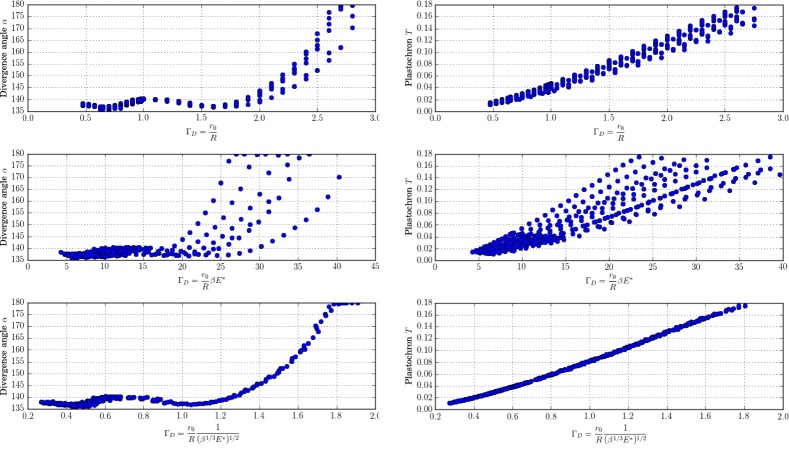
Figure 6. Key parameters controlling phyllotaxis phenotypes in the stochastic model.
Phyllotaxis sequences were simulated for a range of values of each parameter , , . Each point in the graph corresponds to a particular triplet of parameter values and represents the average value over 60 simulated sequences for this triplet. (A) Global amount of perturbation as a function of the new control parameter . (B) Divergence angle as a function of the control parameter of the classical model on the Fibonacci branch. (C) Divergence angle as a function of the new control parameter on the Fibonacci branch (here, we assume s = 3, see Appendix 1—figure 6 for more details). (D) Plastochron as a function of control parameter of the classical model . (E) Plastochron as a function of the new control parameter . (F) Parastichy modes identified in simulated sequences as a function of . Modes are represented by a point . The main modes (1,2), (2,3) … correspond to well marked steps. (Figure 5—source data 1)


