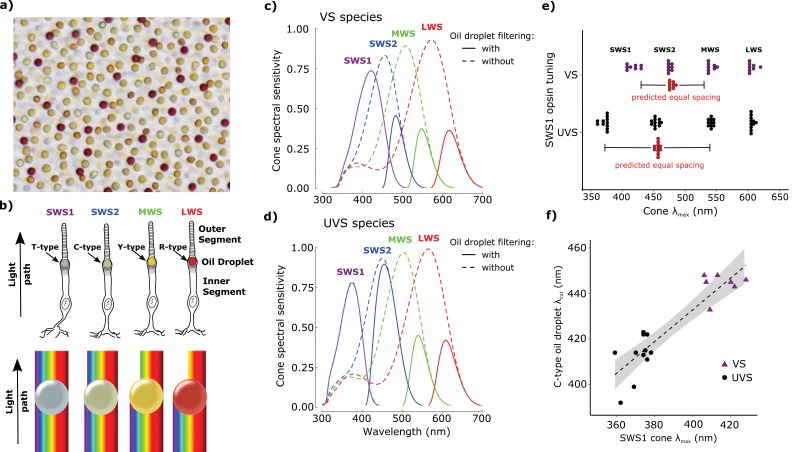
Figure 1. Avian color vision is mediated by four single cone photoreceptors that are tuned by cone oil droplet spectral filters.
(a) A flat-mounted chicken retina under brightfield illumination that shows the distinctive pigmentation of the cone oil droplets. (b) A diagram of the avian single cone photoreceptors showing the relative position of the oil droplet within the cells (top) and a representation of the spectral filtering cutoff effects of the droplet (bottom). The spectral sensitivity of the single cone photoreceptors of the (c) chicken (VS species) and (d) zebra finch (UVS species) with (solid lines) or without (broken lines) the filtering of cone oil droplets. These spectra are scaled to reflect the decrement in absolute sensitivity resulting from oil droplet and ocular media spectral filtering. The SWS1 cone contains a transparent oil droplet, and its short-wavelength sensitivity is limited only by the filtering of the ocular media. (e) The peak sensitivity (λmax) of the four single cone photoreceptors of VS (purple) and UVS (black) species calculated from microspectrophotometric measurements of visual pigment sensitivity and oil droplet filtering in published reports (Supplementary file 2). The red points shown below the SWS2 λmax values are the λmax for each species that would maximize spectral separation from adjacent receptors (λmax of maximum separation = λmax SWS1 + (λmax MWS - λmax SWS1)/2). The actual SWS2 λmax of the UVS species do not differ significantly from these predicted values (paired t-test, t = − 1.27, p = 0.23) and the λmax of the VS species are an average of only 3.6 nm shorter than the predicted values (paired t-test, t = −2.56, p = 0.04). (f) Across bird species there is a significant correlation between the spectral tuning of the SWS1 visual pigment and the blue cone oil droplet filtering cutoff (phylogenetic generalized linear model: t = 5.55, p<0.0001, r2 = 0.63). Each point represents a different species; the dashed line is a linear regression through the points with 95% confidence interval shown in gray.

