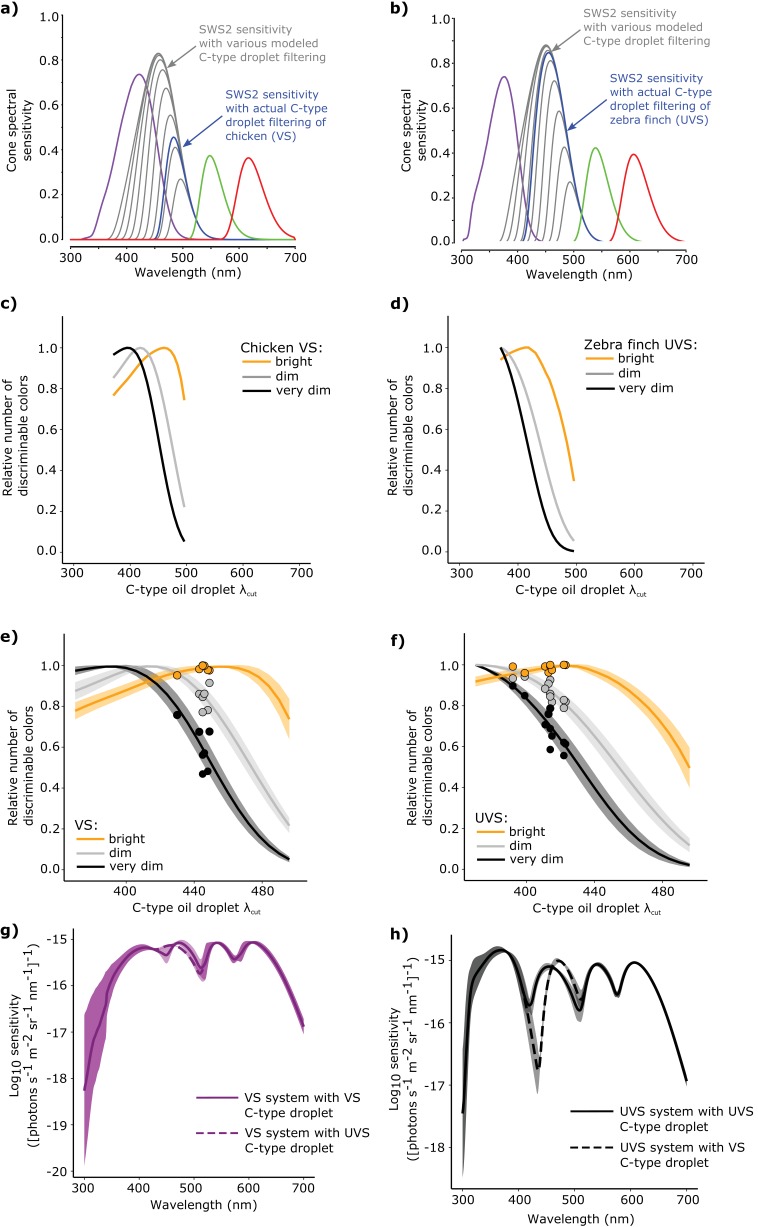
Figure 6. The spectral filtering of the C-type oil droplet is nearly optimal for color discrimination in bright light conditions.
Examples of the spectral sensitivity values of the LWS (red), MWS (green), SWS2 (blue) and SWS1 cones (purple) of (a) chicken (VS) and (b) zebra finch (UVS) used to model color discrimination. To find the optimal C-type oil droplet spectral filtering, we held all other values constant while varying droplet filtering over a wide range, resulting in shifts in the magnitude and wavelength of peak sensitivity of the SWS2 cone (gray lines). We then predicted the total number of colors that each of the hypothetical visual systems (c–d) could discriminate in bright (yellow lines), dim, (gray lines), and very dim light conditions (black lines). We repeated these analyses for a total of (e) 7 VS species and (f) 11 UVS species, and calculated total number of discriminable colors predicted for each C-type oil droplet λcut value under each of the three lighting conditions. The curves represent the mean ± S.D. total discriminable colors as a proportion of the model maximum for each lighting condition: bright (yellow lines), dim, (gray lines), and very dim conditions (black lines). The points above the curves are the observed λcut of the C-type droplets in each VS and UVS species and the predicted number of discriminable colors relative to the modeled optimum. (g) The mean ± S.D. increment spectral sensitivity of the visual systems of the VS species with the typical oil droplet configuration (solid line) or with mismatched C-type oil droplet filtering typical of UVS species (broken line). (h) The mean ± S.D. increment spectral sensitivity of the visual systems of the UVS species with the typical oil droplet configuration (solid line) or with mismatched C-type oil droplet filtering typical of VS species (broken line).
DOI: http://dx.doi.org/10.7554/eLife.15675.017


