
Figure 1. GCP Trajectory by Delirium Status.
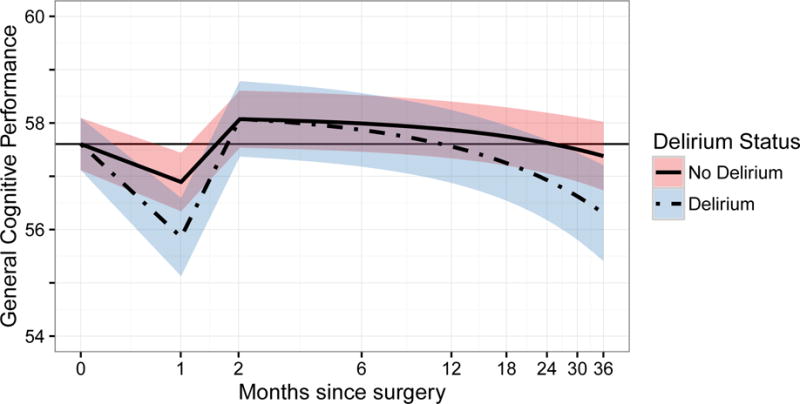
Panel A demonstrates the relationship between the estimated General Cognitive Performance (GCP) scores derived from random effects models (y-axis) and time since surgery on a natural log scale (x-axis). In this figure, the models are adjusted for the effect of baseline GCP score in delirium and cognitive change, since preoperative cognition predicts delirium. Therefore, at baseline delirium status is unknown and both groups start at the overall sample mean value of GCP. The zero-time values represent the preoperative baseline, and follow-up time points are relative to the index surgery and placed on a log scale. The delirium group is indicated by the solid black line surrounded by its associated 95% confidence interval in dark gray shading. The no delirium group is indicated by a gray line, surrounded by its associated 95% confidence interval in light gray shading. Solid gray reference lines indicate the baseline level of GCP. The biphasic relationship of delirium with GCP over time is demonstrated. In the acute phase, patients with delirium experienced a significantly accentuated acute decline in cognitive impairment at 1 month and recovery back to baseline by 2 months. In the long-term phase, patients with delirium experienced a significantly higher rate of cognitive decline over time (see text for details).
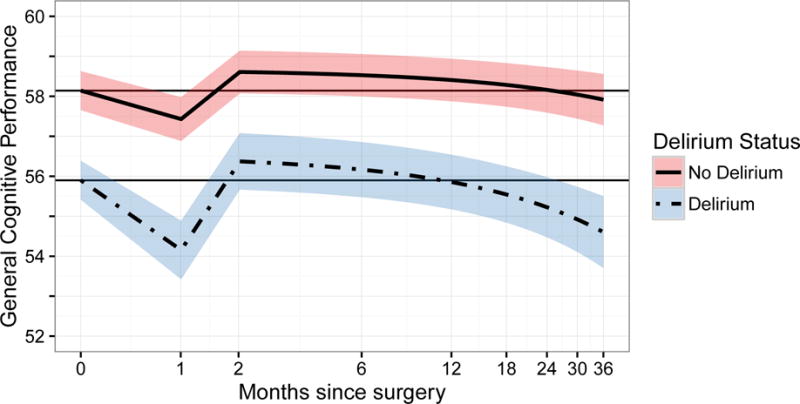
Panel B demonstrates the same models and relationships as Panel A, however, for these models, the starting point of the curves is offset by the mean difference in baseline GCP according to delirium status during hospitalization.