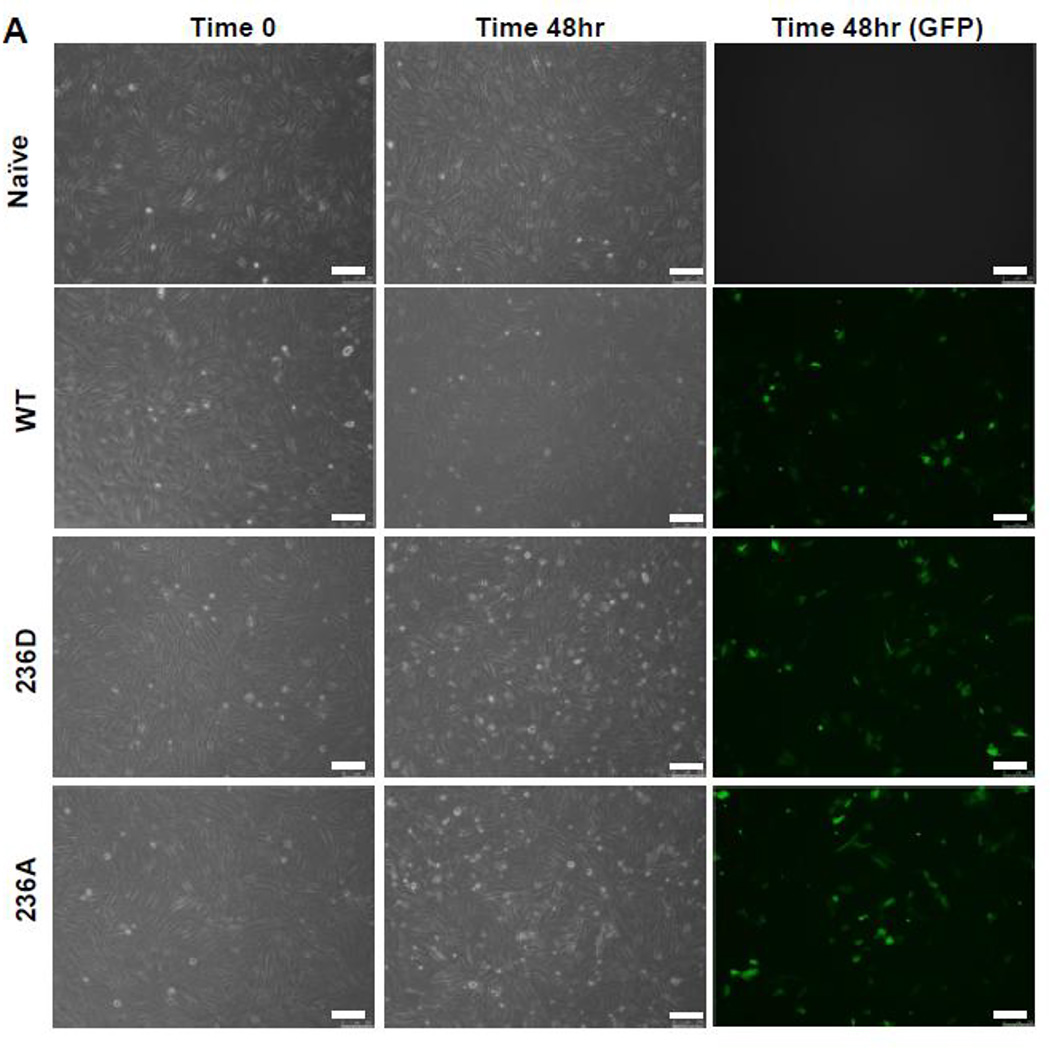
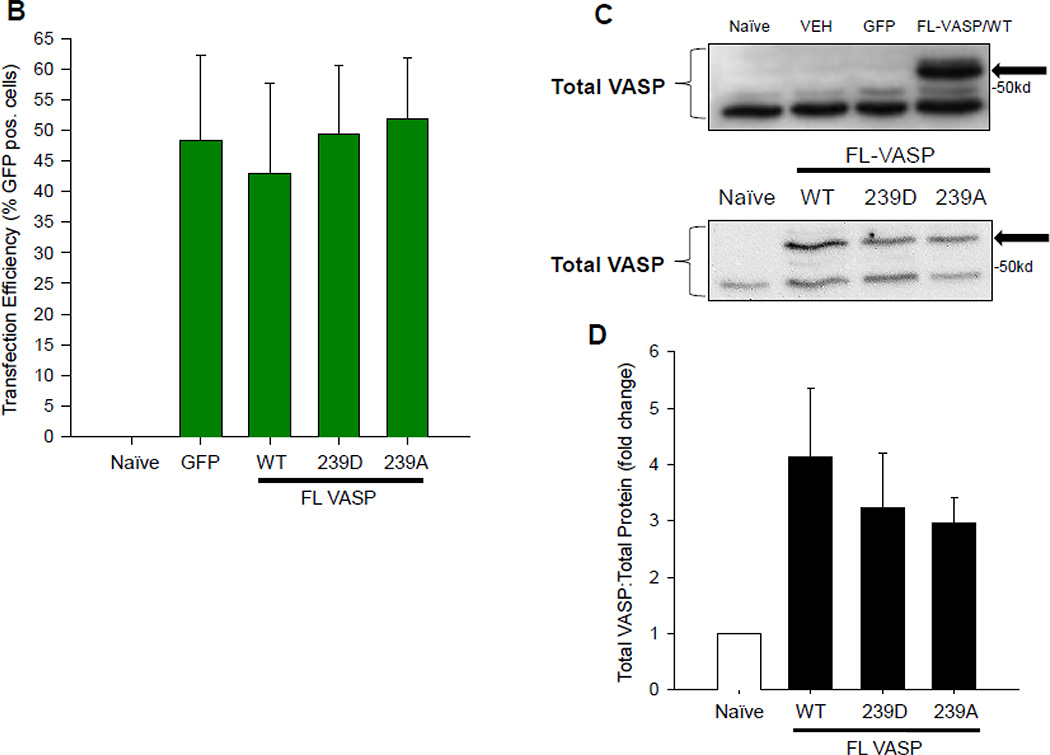
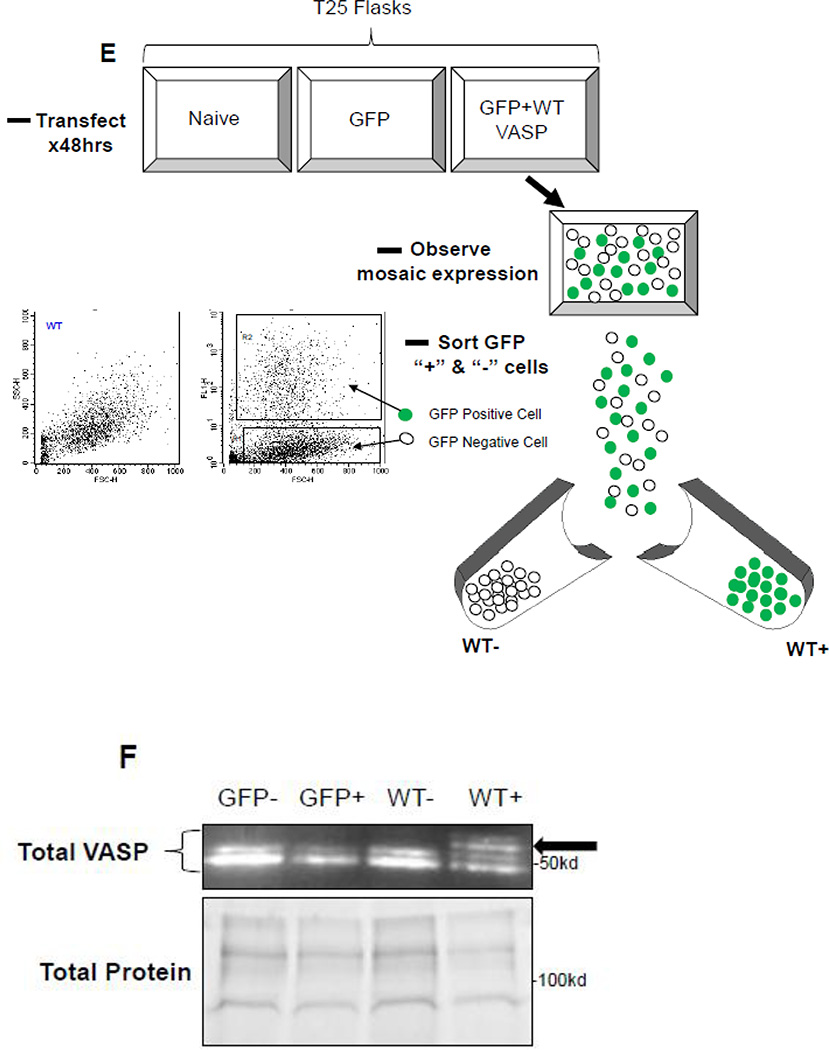
Figure 6. Validation of transient VASP overexpression in ASM cells.
(A) Qualitative, time-course phase contrast and fluorescent photomicrographs of confluent rat A7r5 ASM cells co-transfected with GFP-containing vector showing marked GFP expression 48 hours post-transfection (scale bar=250 µm). (B) FACS analysis reveals ~50% transfection efficiency across all transfected groups. (C) Representative Western blots of total VASP protein expression and (D) densitometry showing marked total VASP expression in all FL VASP-transfected groups (≥ 3-fold increases) compared to naïve cells. Note a distinct protein band just above 50kD in all FL VASP-transfected groups that is not apparent in the naive control group (arrows). (E) Experimental workflow used to verify transfection efficiency and biological activity from a pure population of transfected (GFP-positive) ASM cells (FL-VASP/WT co-transfection is depicted here). This observation of a heavier molecular weight protein band was verified after FACS (F) where this heavier band only appeared in the FL VASP/WT GFP positive cells (arrow) and was absent in all three of the other control groups, including the internal control group of GFP negative cells from the same sorted flask (termed WT “−“).


