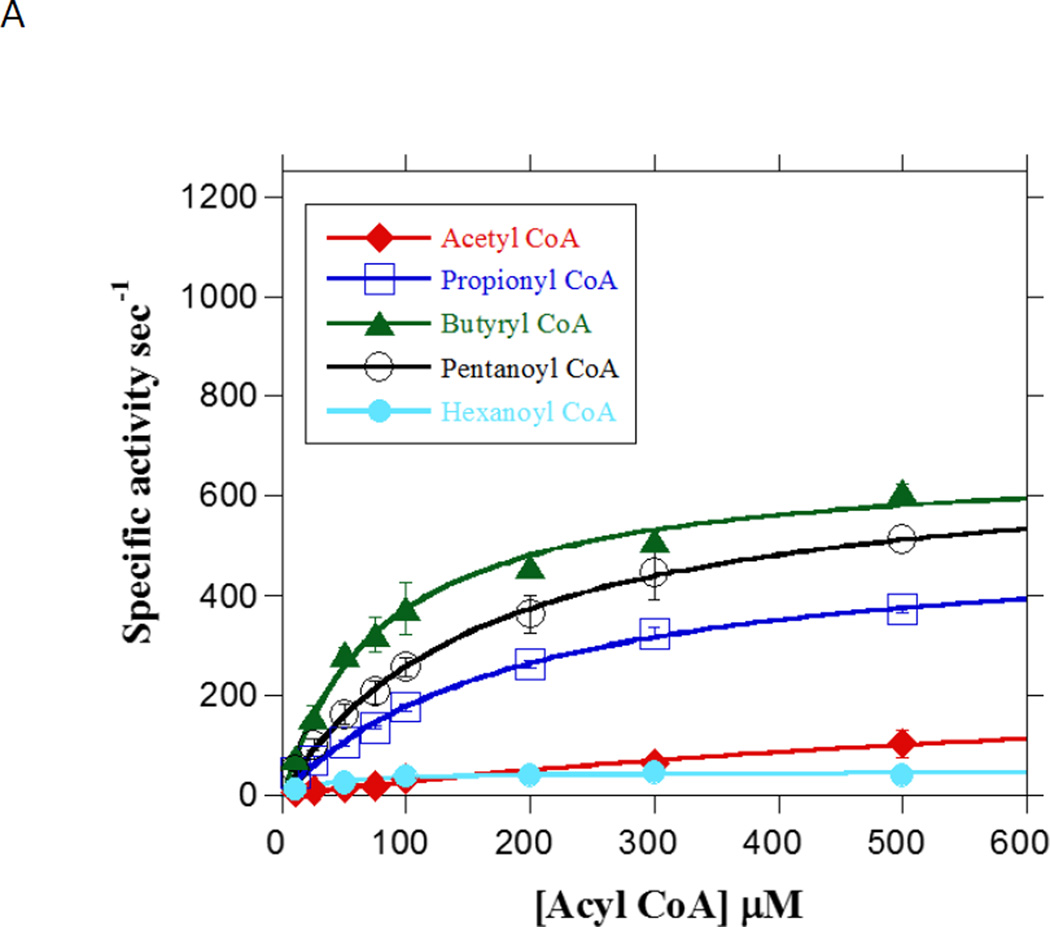
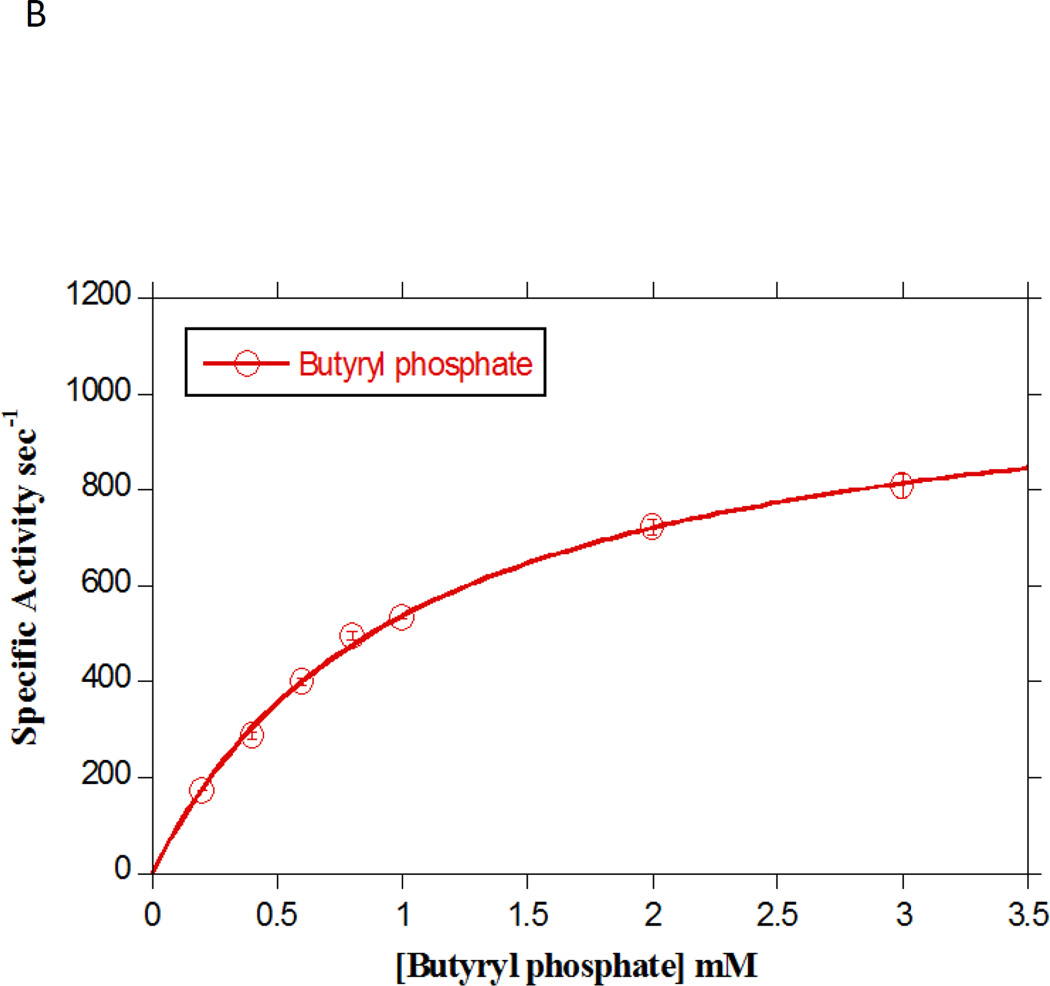
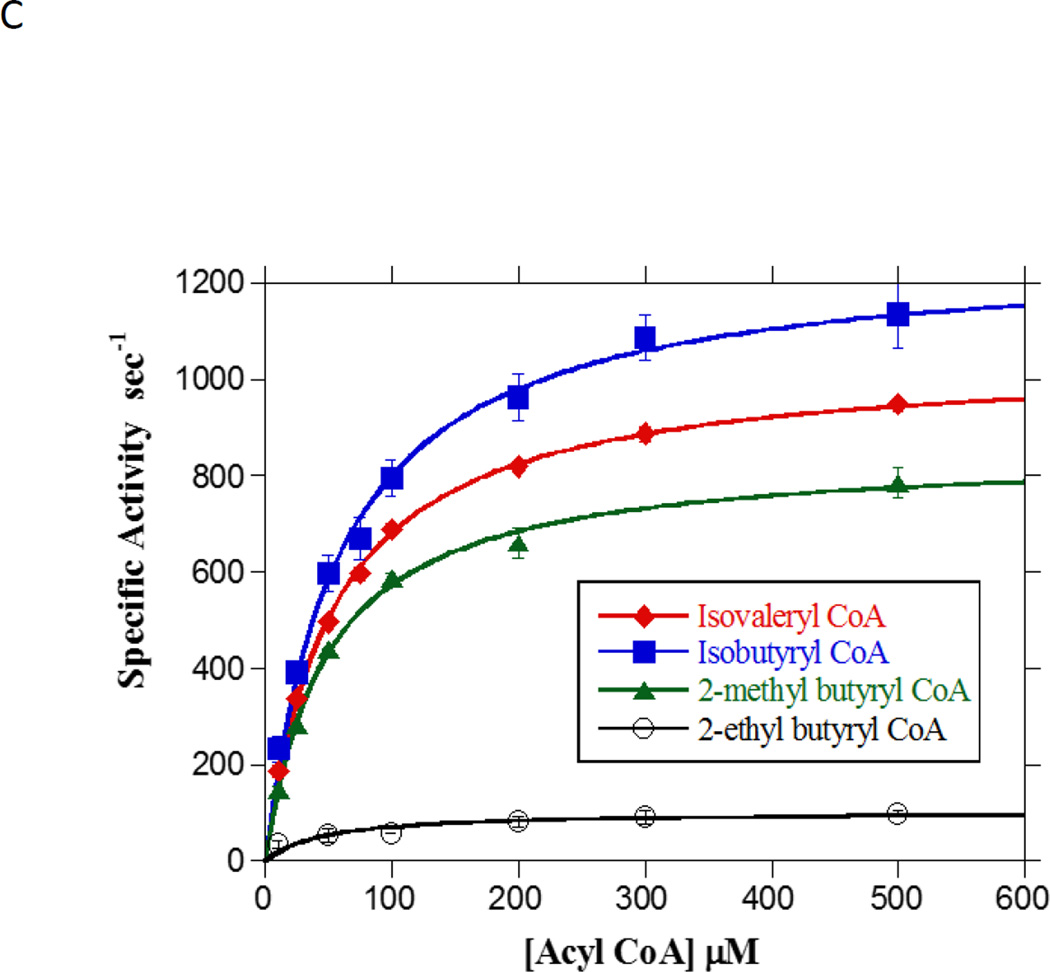
Fig. 4. Substrate preference of LmPtb.
A. Concentration-dependence of straight-chain acyl CoA substrates on Ptb activity assayed in the in the acyl phosphate forming direction. Initial rates for Ptb utilization of the substrates acetyl CoA (closed diamonds), propionyl CoA (open squares), butyryl CoA (closed triangles) and pentanoyl CoA (open circles) and hexanoyl CoA (closed circles) were determined at 25 °C in the presence of 100 mM inorganic phosphate under standard assay conditions (see Materials and Methods). Data are plotted as a function of substrate concentration and KM and kcat were determined from fitting the data to the Michaelis-Menten equation using Kaleidagraph software. Data are means ± SEM of at least three experiments. B. Concentration-dependence of butyryl phosphate on Ptb activity assayed in the acyl CoA forming direction. Initial rates for Ptb utilization of butyryl phosphate (open circles) were determined at 25 oC in the presence of 100 mM Tris and 500 µM CoA (see Materials and Methods). Data were plotted as a function of substrate concentration and KM and kcat were determined from the fit of the data to the Michaelis-Menten equation using Kaleidagraph software. Data plotted are means ± SEM of three experiments. C. Concentration-dependence of branched-chain acyl CoA substrates on Ptb activity assayed in the in the acyl phosphate forming direction. Initial rates for Ptb utilization of the substrates isovaleryl CoA (closed diamonds), isobutyryl CoA (closed squares), 2-methyl butyryl CoA (closed triangles) and 2-ethyl butyryl CoA (open circles) were determined at 25 oC in the presence of 100 mM inorganic phosphate (see Materials and Methods). Data were plotted as a function of substrate concentration and KM and kcat were determined from the fit of the data to the Michaelis-Menten equation using Kaleidagraph software. Data plotted are means ± SEM of at least three experiments.


