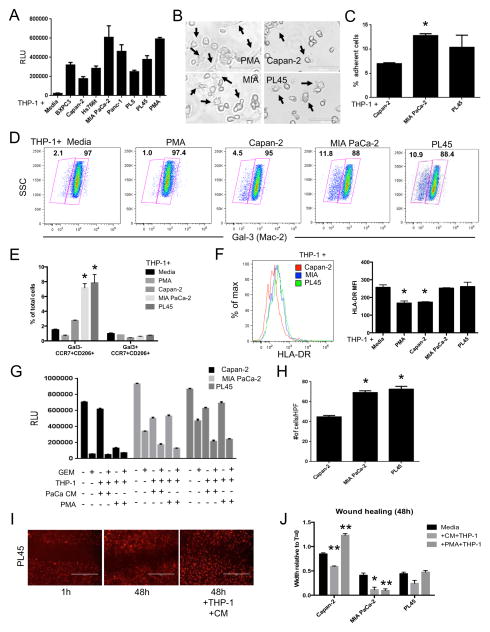
Figure 2. PDA cell products influence the phenotype and function of myeloid cells.
(A) Relative level of THP-1 cell adherence induced by the indicated conditioned media (n=3). (B) Representative phase contrast images (20x) of THP-1 cells treated with PMA or the indicated conditioned media for 72h. Arrows denote cellular morphology indicative of activated macrophages. Scale bars represent 100μm. (C) The relative number of adherent THP-1 cells following treatment with the indicated conditioned media for 72h (n=3). (D) Representative pseudocolor dot plots depicting the differential expression of galectin-3 in THP-1 cells treated with the indicated conditioned media for 72h (n=3). (E) The relative number of Gal3-CCR7+CD206+ and Gal3+CCR7+CD206+ macrophage populations in THP-1 cells treated with PMA or the indicated conditioned media for 72h (n=3). (F) Representative histogram overlay (left) and quantitative analysis (right) of THP-1 cell surface expression of HLA-DR following 72h treatment with the indicated conditioned media. (G) Relative cell survival following treatment of PDA cell lines (n=3) with the indicated combination of gemcitabine (GEM) and/or THP-1 cells differentiated in PMA or PDA cell conditioned media (PaCa CM). (H) The number of PDA cells from the indicated cell lines (n=3) that migrated to the bottom of a transwell membrane in response to PDA-conditioned media activated THP-1 cells. Data were collected from ten randomly selected high-power fields (40x) per sample. (I) Representative images of wound healing in mCherry-expressing PL45 cells after 48h incubation with or without conditioned media (CM) differentiated THP-1 cells. (J) Wound healing in the indicated PDA cell lines over the course of 48h +/− THP-1 cells pre-differentiated for 72h with either PMA or matched PDA CM. For all panels, all data are representative of at least 3 experiments. Graphed data represent mean values ± SEM. * indicates p<0.05. ** indicates p<0.01.

