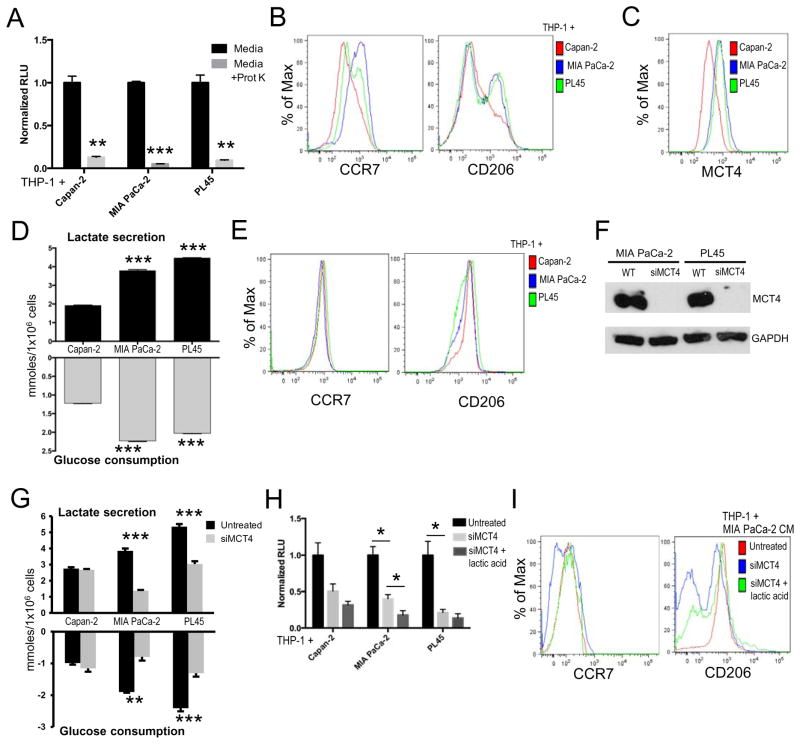
Figure 4. Pancreatic cancer cell metabolism influences myeloid cell differentiation and phenotype.
(A) Relative number of adherent THP-1 cells (n=3 per group) following 24h treatment with the indicated conditioned media +/− proteinase K. (B) Representative expression of CCR7 and CD206 on THP-1 cells (n=3 per group) following exposure to the indicated proteinase K pre-treated conditioned media. (C) Representative expression of MCT4 by the indicated pancreatic cancer cell lines. (D) Amount of lactate secreted and amount of glucose consumed per 1×10⁶ cells by the indicated pancreatic cancer cell lines (n=3 per group). (E) Representative expression of CCR7 and CD206 on THP-1 cells (n=3 per group) following exposure to the indicated lactic acid pre-treated conditioned media. (F) Representative immunoblots of MCT4 expression in PDA cell lines ± siMCT4. (G) Amount of lactate secreted and amount of glucose consumed per 1×10⁶ cells by the indicated pancreatic cancer cell lines ± siMCT4 knockdown (n=3 per group). (H) Relative level of THP-1 cell adherence induced by conditioned media collected from the indicated PDA cell lines ± siMCT4 knockdown and ± lactic acid (n=3). (I) Representative expression of CCR7 and CD206 on THP-1 cells (n=3 per group) following exposure to MIA PaCa-2 conditioned media under the indicated conditions. For all panels, all data are representative of at least 3 experiments. Graphed data represent mean values ± SEM. * indicates p<0.05, ** indicates p<0.01, *** indicates p<0.005.

