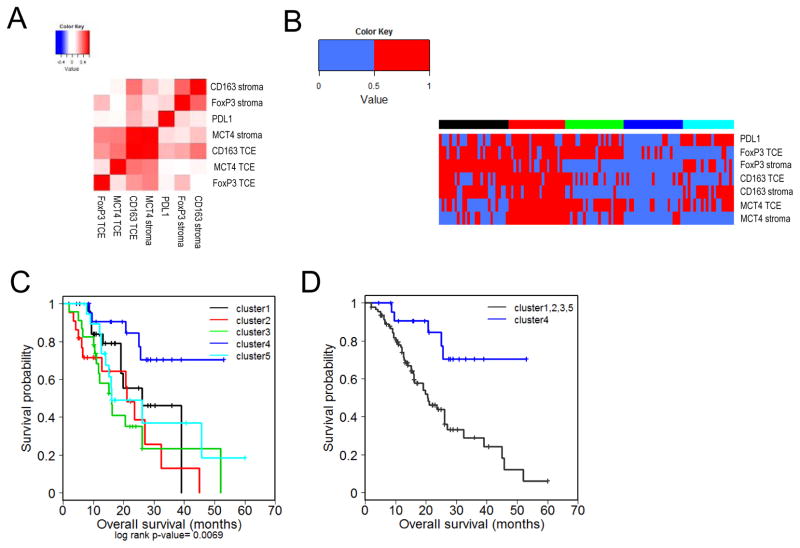
Figure 5. Suppressive immune features and MCT4 expression define prognostic disease subtypes in PDA.
(A) Pearson correlation heat maps of immune markers and MCT4 expression. (B) Heat maps of unsupervised RF clustering of immune marker and MCT4 expression. (C) Kaplan-Meier plots indicating survival probability in human patients based on the previously defined immune marker and MCT4 expression clusters. See supplementary Table S12. (D) Kaplan-Meier plots indicating survival probability in human patients from the cluster of lowest complex expression (cluster 4) with those from clusters with high expression of at least one marker (clusters 1,2,3,5). See supplementary Tables S13, S14.

