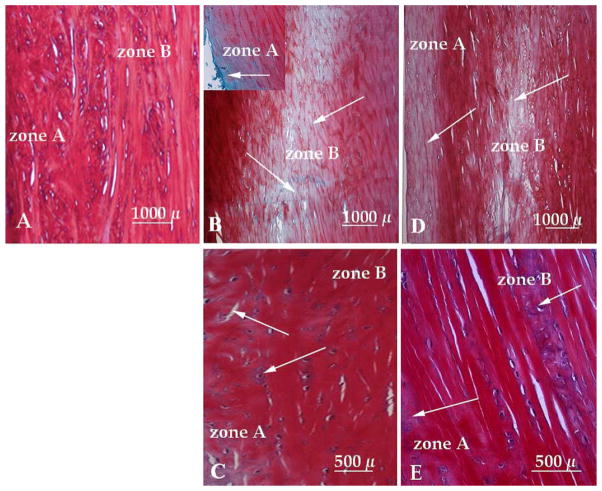
Fig. 1.
Cross sections of meniscus showing (A) normal GAG distribution in a meniscus from non-arthritic knee, (B) GAG loss in zones A (inset) and B in an AIA meniscus immobilized for 24 h, (C) GAG contents in zones A and B in AIA meniscus subjected to CPM for 24 h, (D) GAG loss in zones A and B in AIA meniscus immobilized for 48 h, and (E) GAG contents in AIA meniscus subjected to CPM for 48 h. Arrows indicate regions devoid of GAGs.

