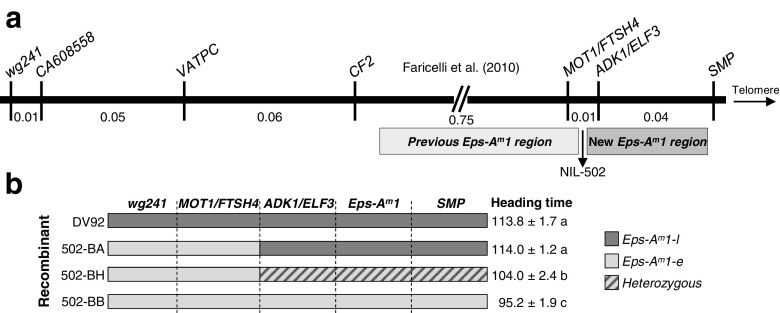
Fig. 1.
a T. monococcum high-density genetic map based on the analysis of 10,000 gametes, showing the previous candidate region for Eps-A m 1 in light gray (Faricelli et al. 2010). The reevaluation of critical NIL 502 resulted in a new candidate region for Eps-A m 1, indicated in darker gray. b Graphical genotypes and heading times of a progeny test of critical NIL 502. Different colors indicate chromosome regions homozygous for the DV92 allele (dark gray), homozygous for the G3116 allele (light gray), or heterozygous (diagonal gray lines). Heading time for each line is shown as the mean of at least five plants ± standard error of the mean. Values followed by different letters are significantly different from each other (P < 0.01). This progeny test confirmed that the Eps-A m 1 locus in NIL 502 was distal to the MOT1/FTSH4 locus

