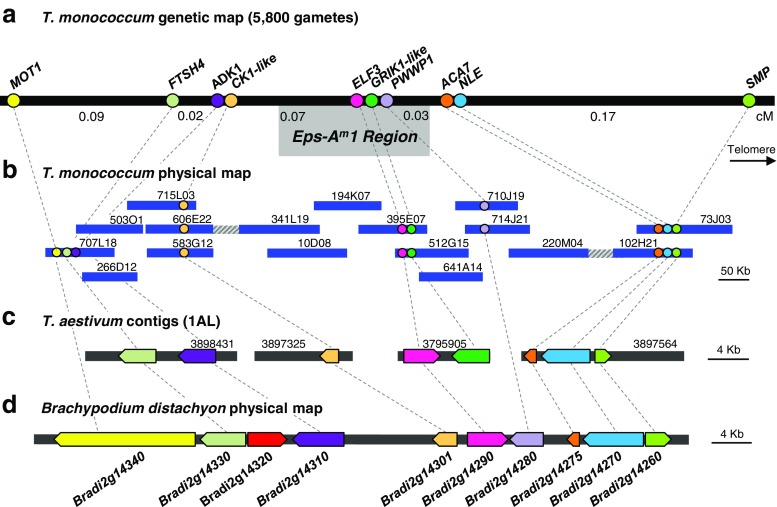
Fig. 2.
a Triticum monococcum high-density genetic map. Genetic distances are based on the analysis of 5800 gametes. Putative genes are color-coded and indicated as circles. b Triticum monococcum physical map. Sequenced BACs are indicated as blue bars and assembly gaps as striped bars. c Triticum aestivum 1AL IWGSC contigs colinear to the Eps-A m 1 region. Contig names were shortened, and only the contig number is shown. d Brachypodium distachyon region colinear to Eps-A m 1

