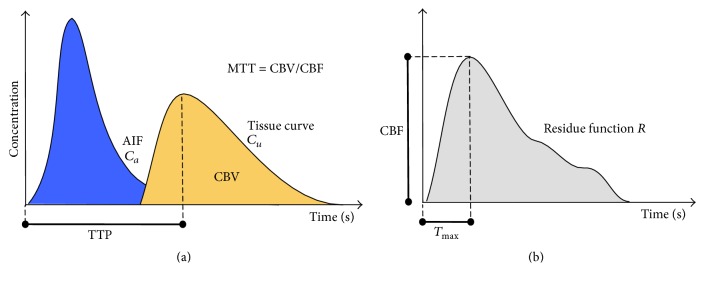
Figure 1.
Illustration of a tissue concentration-time curve C u (yellow) with respect to an arterial input function (AIF) C a (blue). The deconvolution of the tissue curve C u with C a removes the dependence on the AIF and produces the residue function R (b). CBF is extracted at the maximum value reached at T max, while MTT is calculated as CBV/CBF, where CBV is determined as the area under the tissue curve (yellow). Because of the presence of arterial delays in stroke patients, the residue function is not always maximal at t = 0 but might be maximal after a delay (T max).

