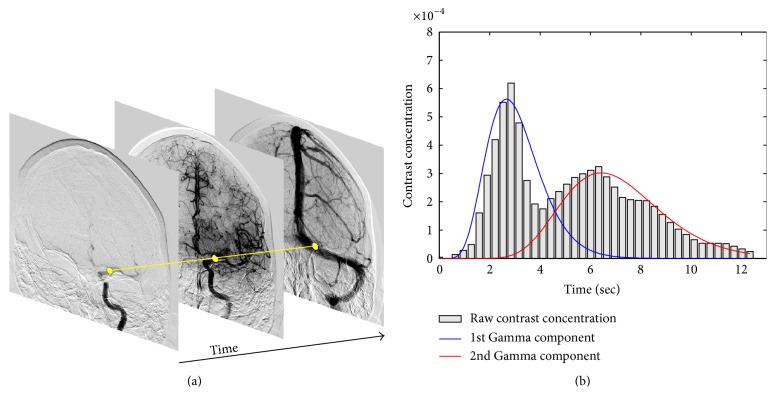
Figure 2.
The bar graph of the contrast concentration-time curve (b) is shown for a specific location in a DSA sequence (shown in yellow on (a)). Two contrast passages can be observed in the concentration-time curve due to the overlap of the vessels. By applying the proposed method based on the EM algorithm, we are able to retrieve the individual components (represented by blue and red curves) using a Gamma mixture representation.

