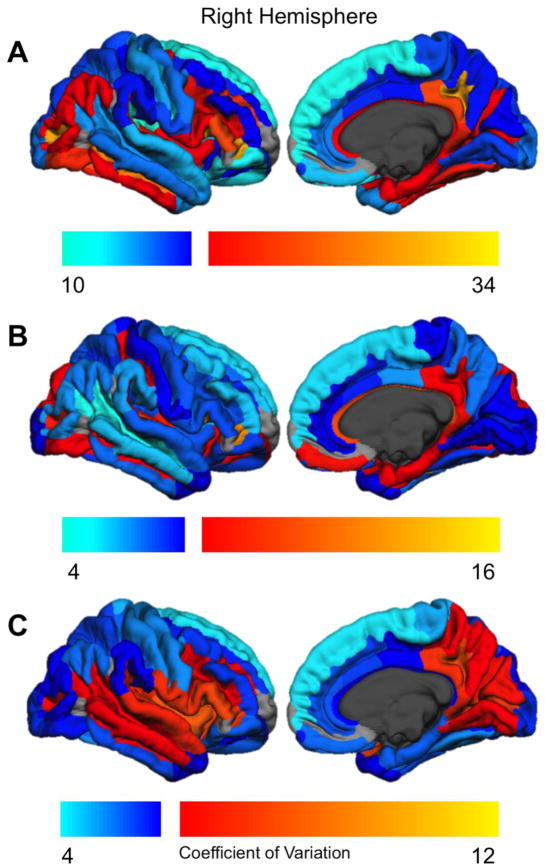
Figure 3.
Regional coefficient of variation for the right hemisphere. Cool colors indicate coefficients below the median value; warm colors indicate coefficients above the median value. Regions not examined due to low concordance indices (Destrieux et al., 2010) are indicated in gray.

