
FIGURE 2.
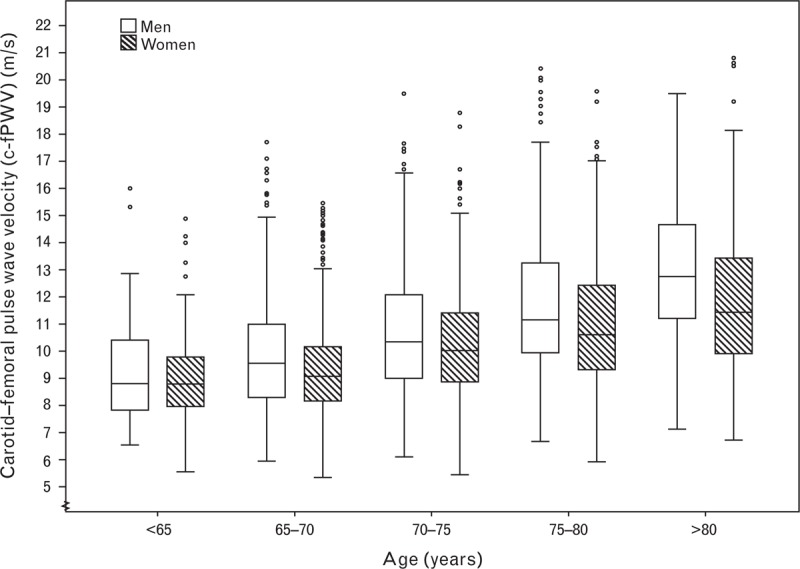
Box-plot of c-fPWV in different age groups, organized by sex. Boxes contain 50% of observations bars contain the remainder. Horizontal lines indicate median value; circles and asterisk indicate outliers and extreme outliers, respectively. c-fPWV, carotid–femoral pulse wave velocity.