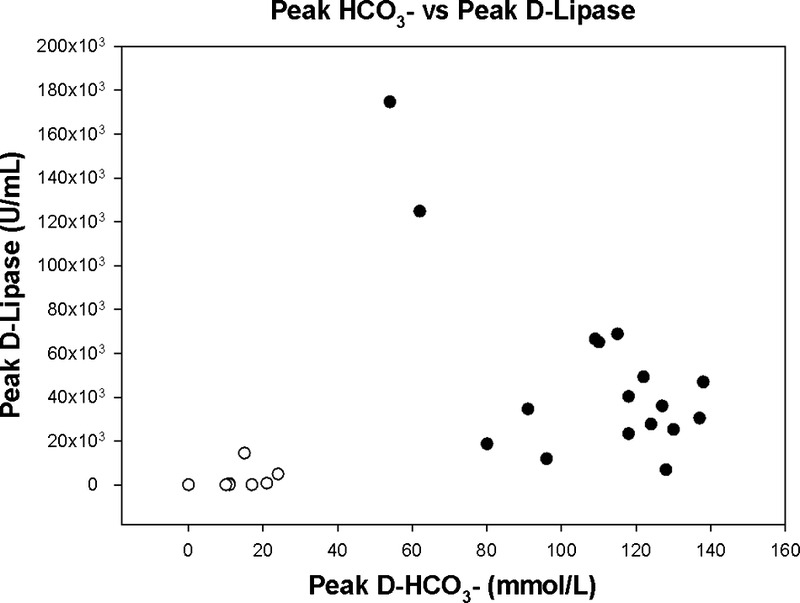
FIGURE 4.

The figure illustrates the correlation between peak duodenal bicarbonate concentration and duodenal lipase activity in the patients with CF. Mark especially the 2 patients with intermediate bicarbonate concentrations, aspirated volumes in the lower normal range and hyperconcentrated duodenal enzymes. White circles indicates CFI; black circles, CFS.
