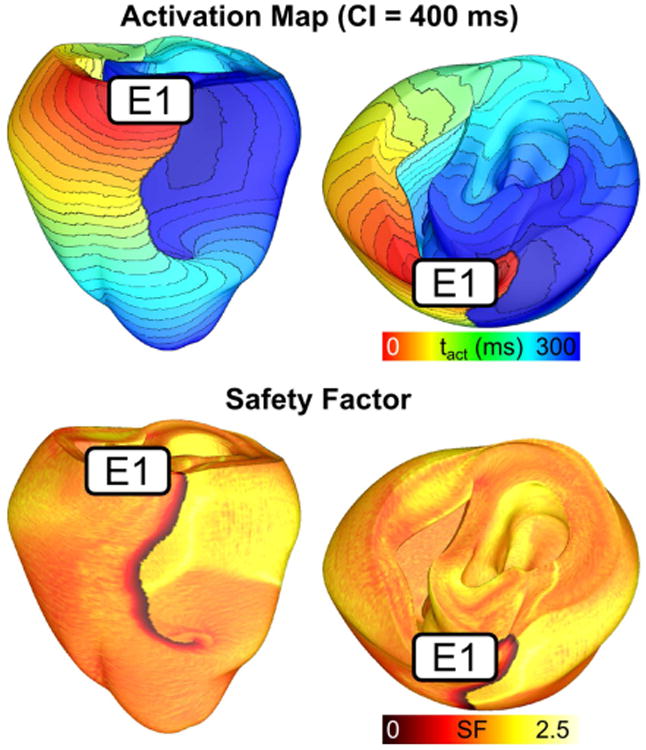
Fig. 3.

Reentry induction due to structural heterogeneity and decreased sodium channel expression. Activation maps showing reentry induced via pacing from an electrode (E1) located on the RV outflow tract. The corresponding safety factor map show that areas with critically low SF (<1) corresponds with site of conduction block at the RVOT insertion point. (Modified and reprinted with permission from (Boyle et al., 2014))
