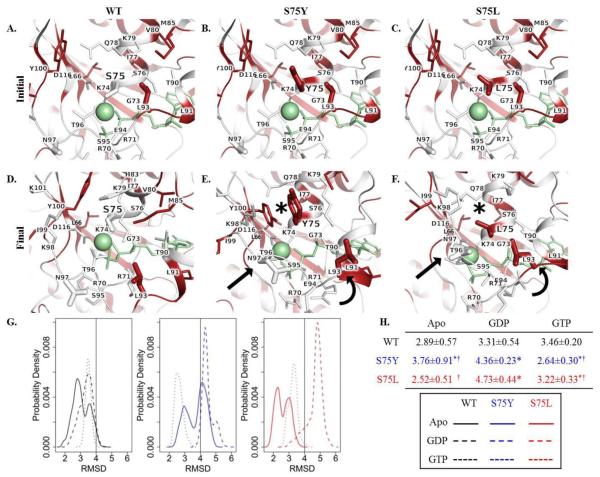
Fig. 2.
In silico protein modeling and molecular dynamics simulation of DCM-associated and engineered RagC substitutions. Face-on view of residue 75 and Mg2+ coordination in the initial state of A. WT, B. S75Y, and C. S75L and final state of D. WT, E. S75Y, and F. S75L RagC. Residues are colored white to red according to increasing hydrophobicity. Ligand GTP and Mg2+ = green stick and sphere, respectively; sticks = sidechain non-hydrogen atoms; asterisk = rearrangement of residues on the upper face; curved arrow = movement of α-helix; straight arrow = compensatory movement of residues to coordinate ligand and Mg2+ after loss of S75 interaction. G. Root mean square deviation (RMSD) desnity profiles reveal consistent conformational expansion of the GDP-bound form in S75Y and S75L mutants. H. RMSD table. Values represent the median ± median absolute deviation. Asterisk indicates p-value <0.05 as compared to corresponding WT-ligand state; † indicates p-value <0.05 comparing Y75 to L75.

