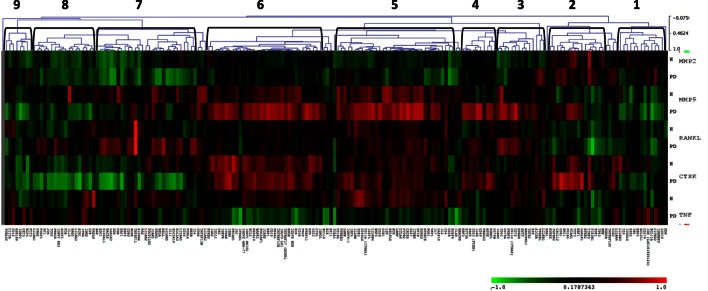
Figure 5.
Heatmap depicting the distribution of correlations of B cell/plasmacyte genes with tissue destructive genes (MMP2, MMP9, CTSK, TNF, and RANKL) in healthy gingival tissues (H, n = 23) and periodontitis tissues (PD, n = 11) of adult and aged animals. The graph displays differences in gene expression in the adult and aged tissues compared with control levels displayed in a group of 10 healthy animals from 3 to 7 years of age. Green denotes negative correlation and red denotes positive correlation with the expression of the tissue destructive genes. The brackets signify the nine gene clusters created based on similarity indices of 0.4–0.5.

