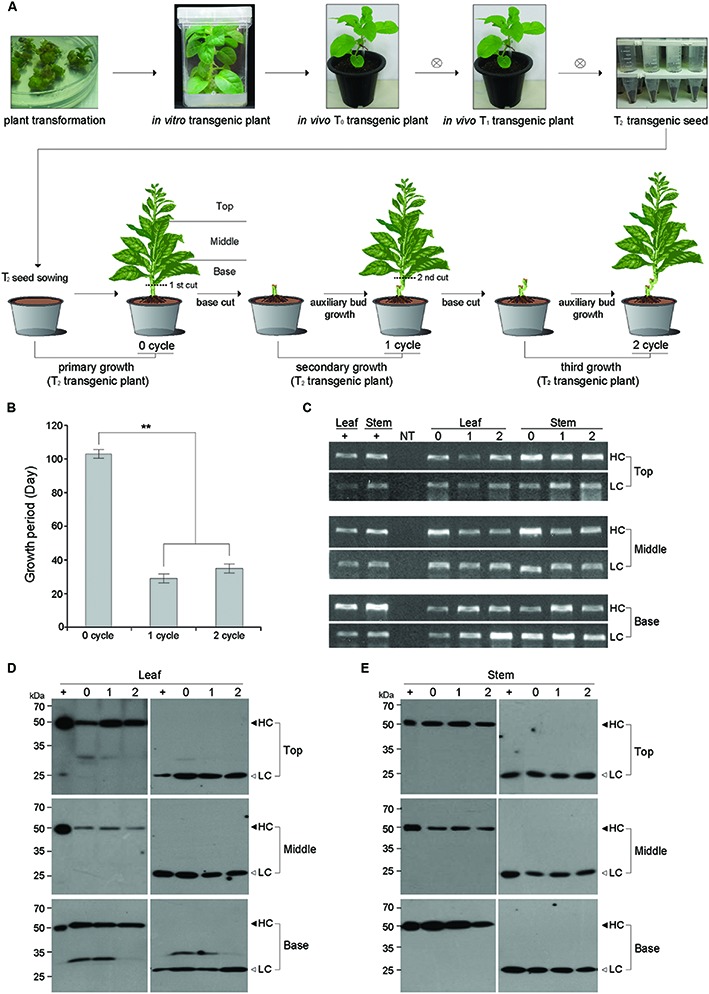
FIGURE 1.

Schematic diagram for the primary (0 cycle), secondary (1 cycle), and tertiary (2 cycle) growth of plants expressing the anti-colorectal cancer mAb CO17-1A. (A) Schematic diagram showing primary (0 cycle), secondary (1 cycle), and tertiary (2 cycle) growths from T0 transgenic plants. The base stem of 0 cycle plant was cut to induce axillary buds for secondary plant growth (1 cycle), and the base stem of the 1 cycle plant was cut for the tertiary plant growth (2 cycle). T, top of the whole plant; M, middle of the whole plant; B, base of the whole plant. (B) Comparison of plant growth period for flowering in 0, 1, and 2 cycles. The growth of 0 cycle plants was compared with 1 and 2 cycle plants obtained from base stem cutting. The asterisks indicate statistically significant differences (∗∗p < 0.01). (C) PCR analysis to confirm the existence of HC and LC genes in top, middle, and basal portions of both the leaves and stems of transgenic plant (0, 1, and 2 cycles). The genomic DNA fragments of mAbP CO17-1A were amplified and electrophoretically separated on a 1% agarose gel. NT, non-transgenic plant; HC, heavy chain of mAbP CO17-1A; LC, light chain of mAbP CO17-1A. (D,E) Western blot analysis to confirm the mAbP CO17-1A HC and LC expression in the leaves and stems of transgenic plants through 0, 1, and 2 cycles. The bands for HC (50 kDa) and LC (25 kDa) were detected with horse radish peroxidase-conjugated goat anti-mouse Fc and goat anti-mouse F(ab)′2-specific antibody, respectively. +, purified mAb CO17-1A from plant (So et al., 2012); Top, top portion of plant; Middle, middle portion of plant; Base, basal portion of plant (A).
