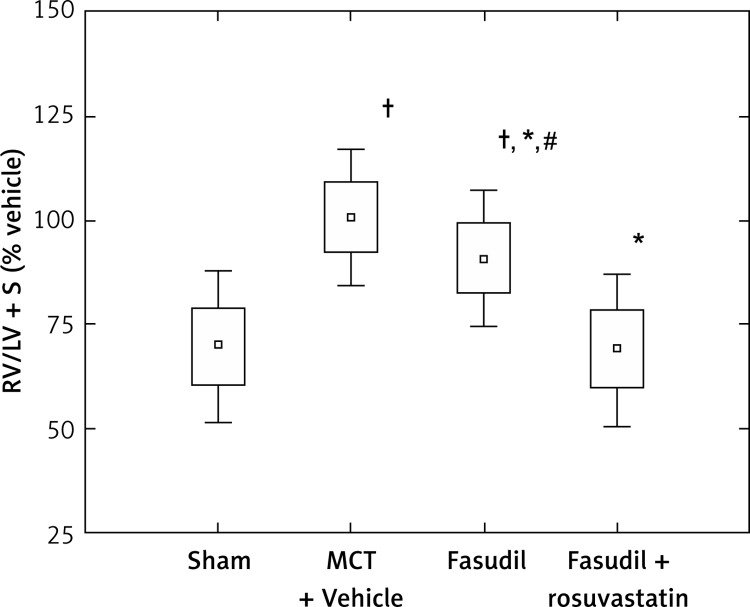
Figure 2.
Right ventricle hypertrophy expressed as the ratio of the right ventricular weight to left ventricle plus septum weight (RV/LV + S), as percentage of MCT + Vehicle. Sham (n = 8); MCT + Vehicle (n = 9); fasudil (n = 6); fasudil + rosuvastatin (n = 9)
The histograms indicate: mean ± SD (□) and mean ± 1.96*SD (⊥); *p < 0.05 vs. MCT + Vehicle; †p < 0.0005 vs. Sham; #p < 0.0005 vs. combination group.

