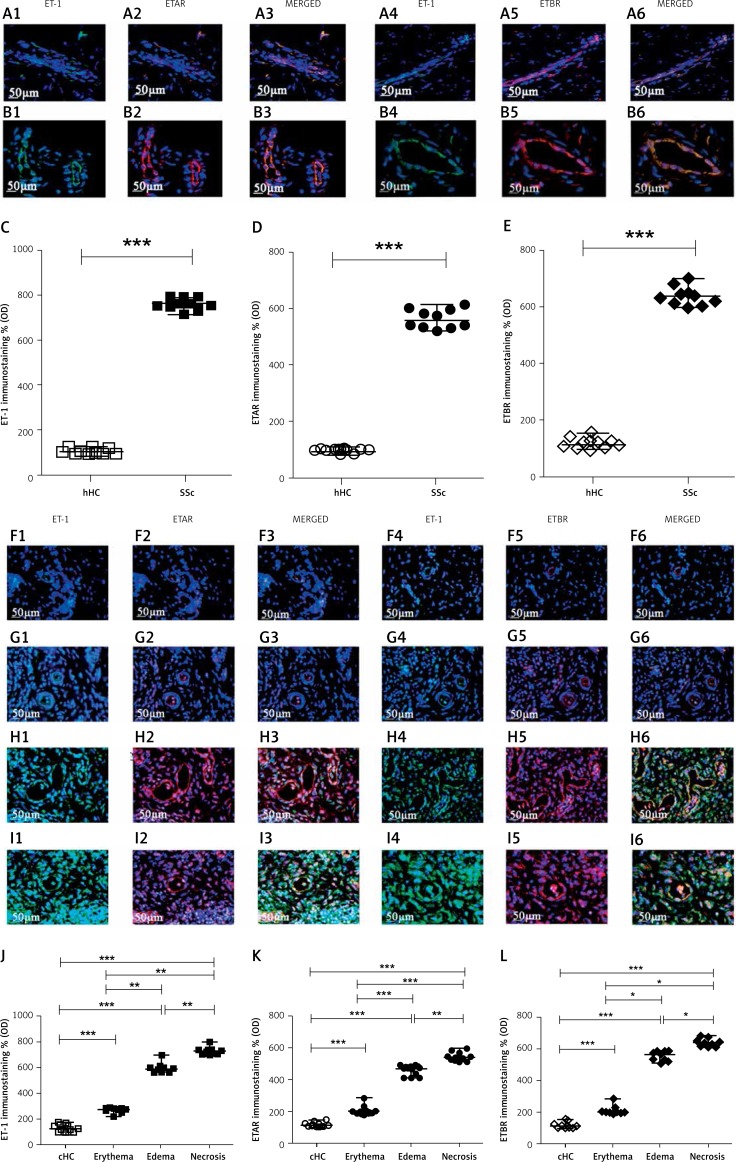
Figure 4.
Expression of ET-1, ETAR and ETBR in UCD-200 comb biopsies. A, B – The figure shows the staining of ET-1 (1), ETAR (2) their MERGED (3) and of ET-1 (4), ETBR (5), their MERGED (6), in hHC (A) and in SSc patients (B). The expression of ET-1, ETAR and ETBR in SSc patients was significant higher than in hHC. F, G, H, I – The figure shows the staining of ET-1 (1), ETAR (2) their MERGED (3) and of ET-1 (4), ETBR (5), their MERGED (6), in cHC (F) and in UCD-200 combs with erythema (G), edema (H) and necrosis (I). The increased expression of the ET-1/ETR axis parallels the severity of the disease. C, J – Densitometric analysis of ET-1 immunofluorescence intensity of human (C) and chicken (J). Each open square (□) represents the ET-1 value of both 1 hHC and 1 cHC; each solid square (■) represents the ET-1 value of 1 SSc patient and 1 UCD-200 sample. Our results are expressed as median (range) of the immunofluorescence optical density (arbitrary units). The ET-1 expression of SSc patients was significantly higher than in hHC (ET-1, hHC vs. SSc: ***p < 0.0001). Significantly higher ET-1 optical density was observed in each UCD-200 group than in cHC. Furthermore, a significant increase of the optical density was observed in parallel with the severity of comb involvement (ET-1, erythema vs. edema: **p = 0.0002; edema vs. necrosis: **p = 0.0002). D, K – Densitometric analysis of the intensity of immunofluorescence staining of human (D) and chicken (K) ETAR. Each open dot (○) represents the ETAR value of both 1 hHC and 1 cHC; each solid dot (●) represents the ETAR value of 1 SSc patient and 1 UCD-200 sample respectively. Our results are expressed as median (range) of the immunofluorescence optical density (arbitrary units). The expression of ETAR was significantly higher in SSc patients than in hHC (ETAR, hHC vs. SSc: ***p < 0.0001). Significantly higher ETAR optical density was observed in each UCD-200 group than in cHC. Furthermore, a significant difference of the optical density was observed when any group of UCD-200 samples was compared with another, showing a progressive increase of the optical density in parallel with the severity of comb involvement (ETAR, erythema vs. edema: **p < 0.0001; edema vs. necrosis: **p = 0.0002). E, L – Densitometric analysis of the intensity of human (E) and chicken (L) ETBR immunofluorescence staining. Each open rhombus (◊) represents the ETBR value of both 1 hHC and 1 cHC; each solid rhombus (♦) represents the ETBR value of 1 SSc patient and 1 UCD-200 sample respectively. Our results are expressed as median (range) of the immunofluorescence optical density (arbitrary units). The expression of ETBR was significantly higher in SSc patients than in hHC (ETBR, hHC vs. SSc: ***p < 0.0001). Significantly higher ETBR optical density was observed in each UCD-200 group than in cHC. Furthermore, a significant difference of the optical density was observed when any group of UCD-200 samples was compared with another, showing a progressive increase of the optical density in parallel with the severity of comb involvement (ETBR, erythema vs. edema: *p = 0.0004; edema vs. necrosis: *p = 0.0004)

