Figure 1.
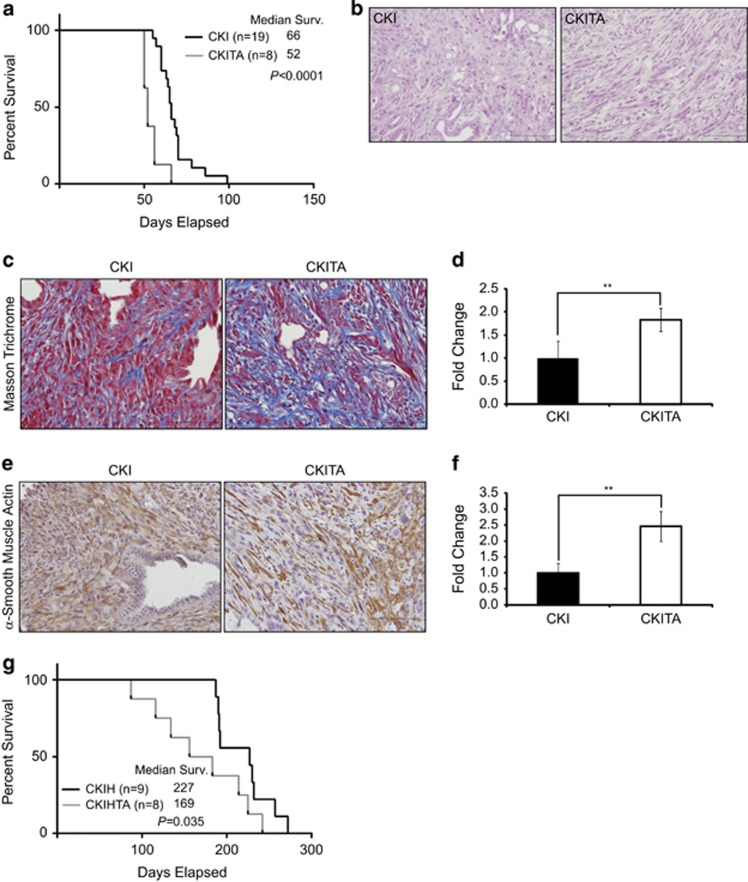
TAp73 is a tumor suppressor in Kras-driven PDA mouse models. (a) Median survival curves of CKI and CKITA mice (Gehan–Breslow–Wilcoxon; P<0.0001, n=19 and 8 for CKI and CKITA, respectively). (b) Representative H&E histology from two independent CKI and CKITA pancreas. Scale bar represents 100 μm. (c) Representative Masson Trichrome staining in PDA sections from CKI and CKITA mice, as quantified in d using unpaired Student's t-test (**P<0.01). Scale bars represent 100 μm. (e) Representative αSMA staining in PDA sections from CKI and CKITA mice, as quantified in f using unpaired Student's t-test (**P<0.01). Scale bars represent 100 μm. (g) Median survival curves of CKIH and CKIHTA mice (Gehan–Breslow–Wilcoxon; P=0.035, n=9 and 8 for CKIH and CKIHTA, respectively). Error bars represent S.D.

