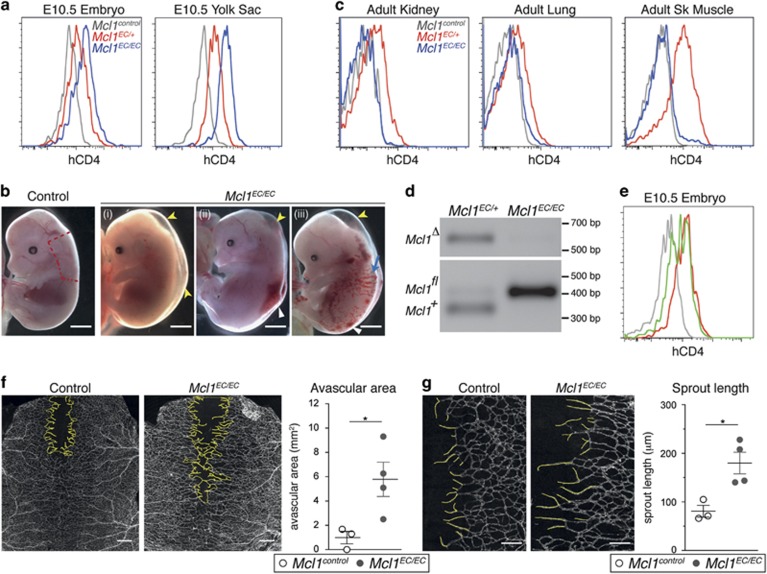
Figure 1.
Mcl1EC/ECembryos show a range of phenotypes at E14.5 while surviving adult Mcl1EC/EC mice do not show deletion of Mcl1 in ECs. (a) Representative flow cytometric analysis of hCD4 expression (a reporter of Mcl1fl allele recombination) on E10.5 embryo proper and yolk sac ECs from Mcl1control (n=12, gray lines), Mcl1EC/+ (n=7, red lines) and Mcl1EC/EC (n=4, blue lines) embryos. Control genotypes include Mcl1fl/+;Tie2-Cre+/+, Mcl1fl/fl;Tie2-Cre+/+ and Mcl1+/+;Tie2-CreT/+. Data from three litters. (b) Representative images of Mcl1control(n=60) and Mcl1EC/EC (n=18) E14.5 embryos. Data from 18 litters. Yellow arrowhead indicates edema, white arrowhead indicates hemorrhage and blue arrow indicates possible blood-filled lymphatic vessels. Red line demarcates region of dorsal skin used for quantification of vasculature in F and G. Scale bar=2 mm. (c) Representative flow cytometric analysis of hCD4 expression on adult kidney, lung and skeletal muscle ECs from Mcl1control (n=6, gray line), Mcl1EC/+ (n=6, red line) and Mcl1EC/EC (n=6, blue line) mice. Control genotypes include Mcl1fl/+;Tie2-Cre+/+, Mcl1fl/fl;Tie2-Cre+/+ and Mcl1+/+;Tie2-CreT/+. Data from six litters. (d) Representative genomic PCR result from fluorescence-activated cell sorting sorted kidney ECs isolated from Mcl1EC/+ (n=3) and Mcl1EC/EC (n=3) mice. (e) Flow cytometric analysis of hCD4 expression from an E10.5 Mcl1iEC/+ embryo (n=1, green line) showing inefficient recombination of the conditional allele compared with Mcl1control (n=12, gray line) and an Mcl1EC/+ embryo with efficient Mcl1 allele deletion (n=7, red line). (f) Representative images of E14.5 dorsal skin vasculature stained for PECAM1 from Mcl1control (n=3) and Mcl1EC/EC (n=4) embryos. Yellow line demarcates avascular region. Scale bar=500 μm. Graph shows quantification of avascular region from Mcl1control (n=3, open circles) and Mcl1EC/EC (n=4, closed circles) embryos. (g) Representative images of dorsal skin vasculature quantified for sprout length stained for PECAM1 from Mcl1control (n=3) and Mcl1EC/EC (n=4). Yellow lines trace sprouts to nearest branch point. Scale bar=200 μm. Graph shows quantification of mean sprout length per embryo from Mcl1control (n=3, open circles) and Mcl1EC/EC (n=4, closed circles) embryos. Mean±S.E.M. *P⩽0.05, Student's two-tailed t-test

