Figure 5.
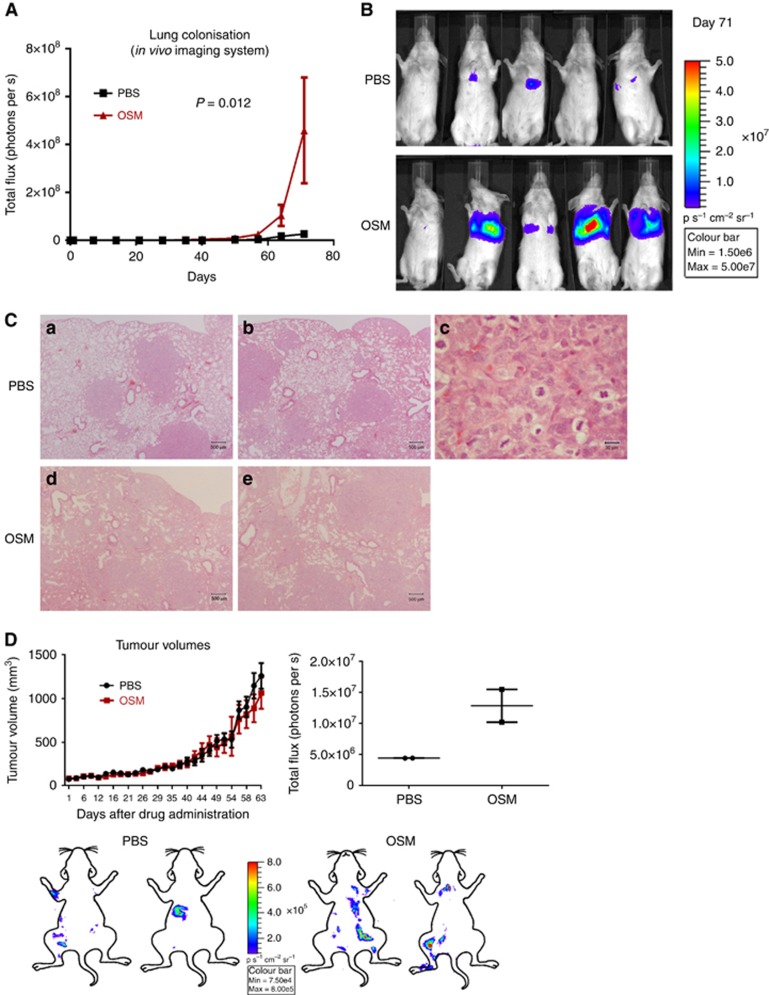
OSM increases lung colonisation by OSMR overexpressing SW756 cervical SCC cells. (A) Time course quantification of the thoracic bioluminescent signal from mice following tail vein injection of SW756 cells and intraperitoneal injection of OSM or PBS (n=5 per group). (B) Luminescence images from the end point of the experiment shown in A. (C) Representative images of lung tissue at the end point of the experiment shown in A. Images a–c are from PBS-treated animals, while images d and e are from OSM-treated animals. Image c is a high-magnification view of a region of image b. (D) The line graph (upper row, left) shows growth of primary subcutaneous xenografts of SW756 cells treated with peri-tumoral injections of OSM or PBS (n=4 per group). The images (lower row) were generated from bioluminescence analysis of mice at the end of the experiment, after removal of the xenografts and visceral organs. The images were overlapped with cartoon outlines to indicate the approximate locations of the skeletal luminescence signals. However, they are not precisely localised, due to variations in the orientation of the mice during optical imaging. The dot plot (upper row, right) shows the relatively greater levels of skeletal luminescence in mice bearing xenografts treated with OSM versus those treated with PBS (n=2 per group).

