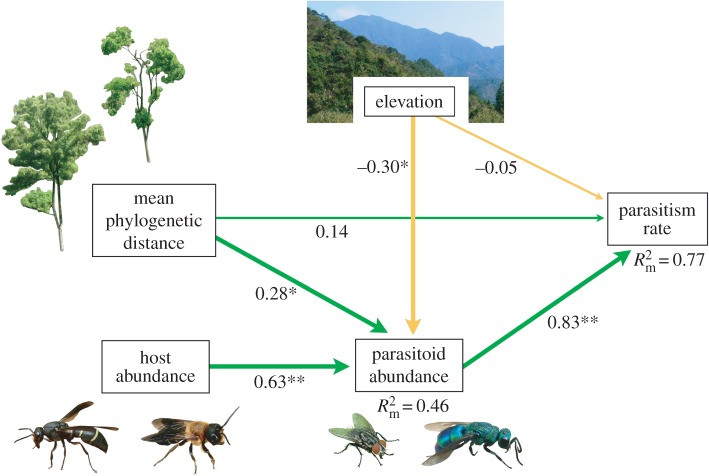
Figure 2.
Path model (C = 4.75, p = 0.14) showing that parasitism rate is influenced by MPD and elevation via parasitoid abundance. Numbers next to the arrows give the standardized path coefficients. Significant causal paths are indicated with bold arrows. Green (darker) arrows indicate positive relationships, golden (lighter) arrows negative relationships. Significances are **p < 0.01 and *p < 0.05. R² values are marginal R². All photographs by Michael Staab. (Online version in colour.)

