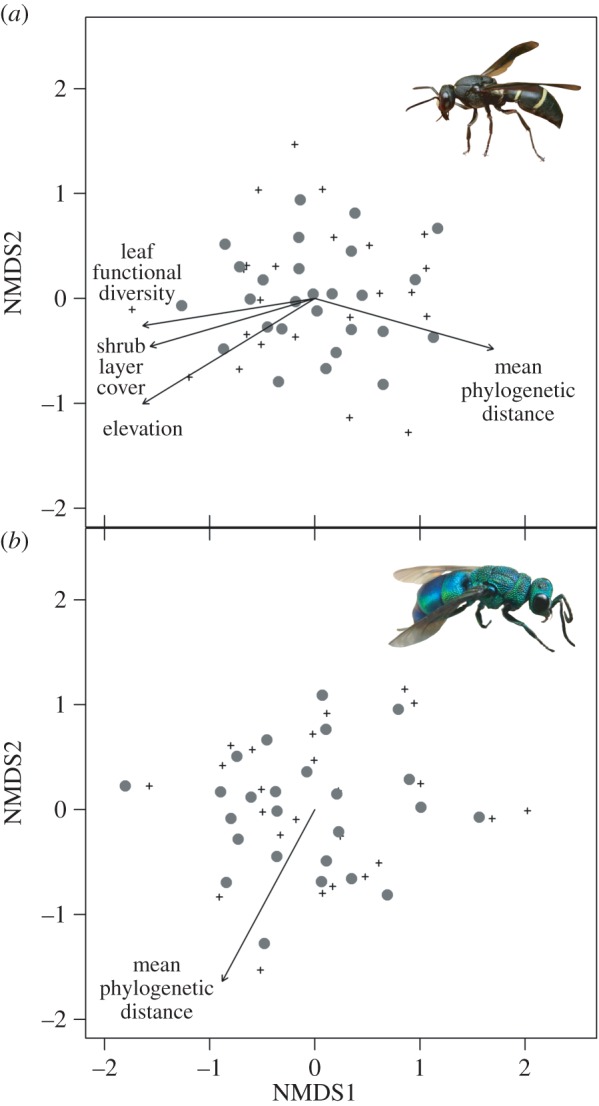
Figure 3.

NMDS ordinations of (a) hosts (stress = 0.21) and (b) their associated parasitoids (stress = 0.17). Grey dots refer to the 27 study plots, black crosses to the species in each community. Arrows indicate significant correlations of environmental variables with plot-based axis scores. The length of the arrows is proportional to the strength of a given correlation. Details on correlations are given in electronic supplementary material, table S6. (Online version in colour.)
