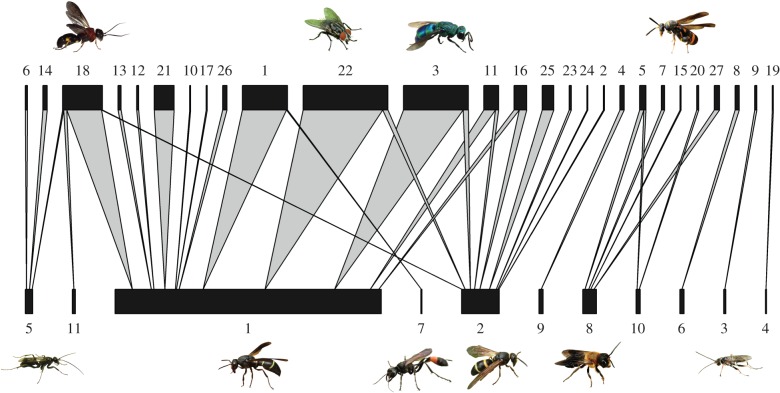
Figure 4.
Total quantitative bipartite host–parasitoid network. Width of bars corresponds to the number of parasitized host brood cells per species; width of arrows corresponds to the number of interactions between hosts (below) and parasitoids (above). Single interactions are indicated by the most narrow bars and arrows. Numerical codes refer to electronic supplementary material, table S3. Pictures of specimens correspond to the numerical codes next to them. All photographs by Michael Staab. (Online version in colour.)

