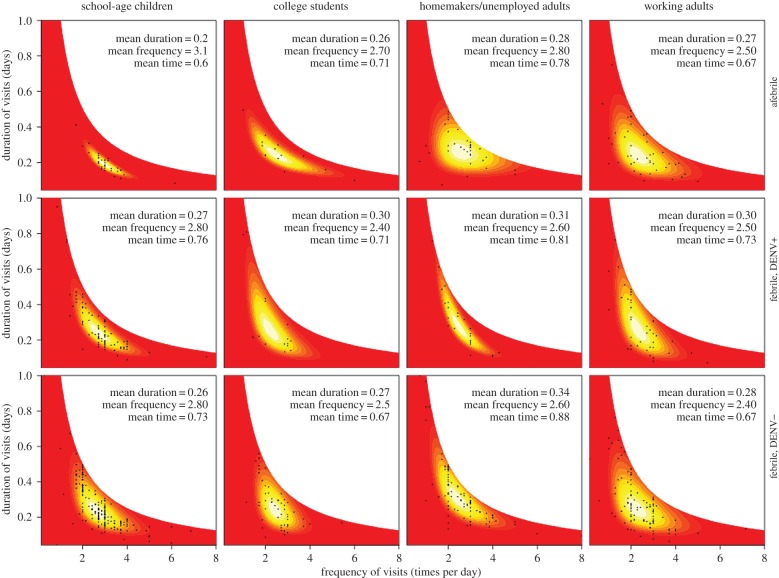
Figure 2.
Joint probability distributions of the frequency and mean duration of periods of time spent at home. Colours represent continuous probabilities that range low (red), medium (orange), and high (bright yellow and white). Parameter values of each distribution were fitted by likelihood maximization to data from individuals from each of four groups (children, students, homemakers, others) using interviews conducted when those individuals either had no fever, dengue fever, or fever due to some other cause. Sample means of duration, frequency and proportion of total time spent at home for each group are noted in each panel.

