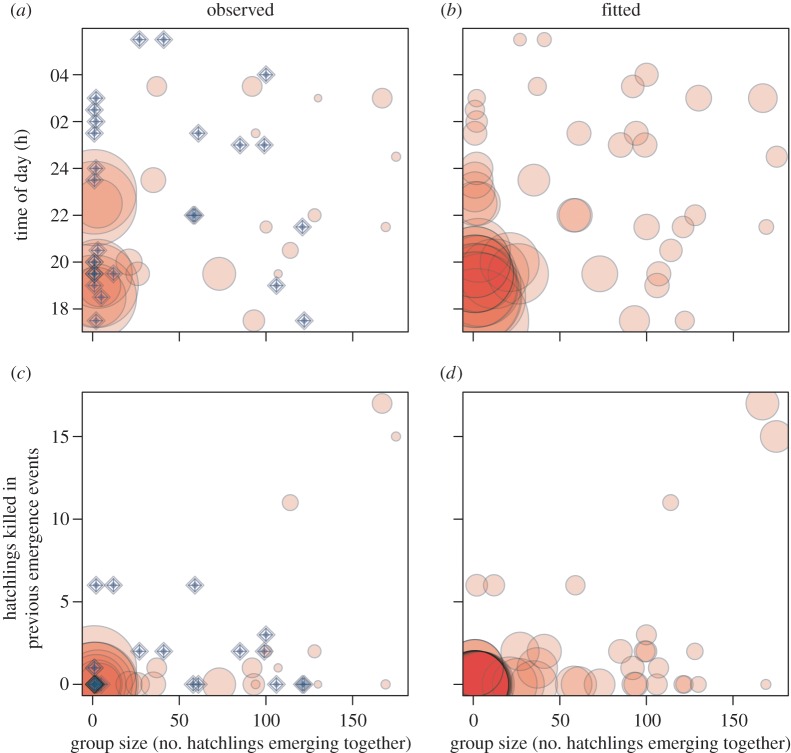
Figure 3.
Determinants of predation risk in green turtle hatchlings. Per capita predation risk is represented by bubble area; groups without any mortality (i.e. zero risk) are represented by diamonds. Risk is plotted against group size and (a,b) time of day or (c,d) number of prey already killed that evening. (a) and (c) show the observed risk per group, while (b) and (d) show the fitted (i.e. predicted) risk from GLMMs with the two axes as interacting covariates and nest as a random factor. (Online version in colour.)

