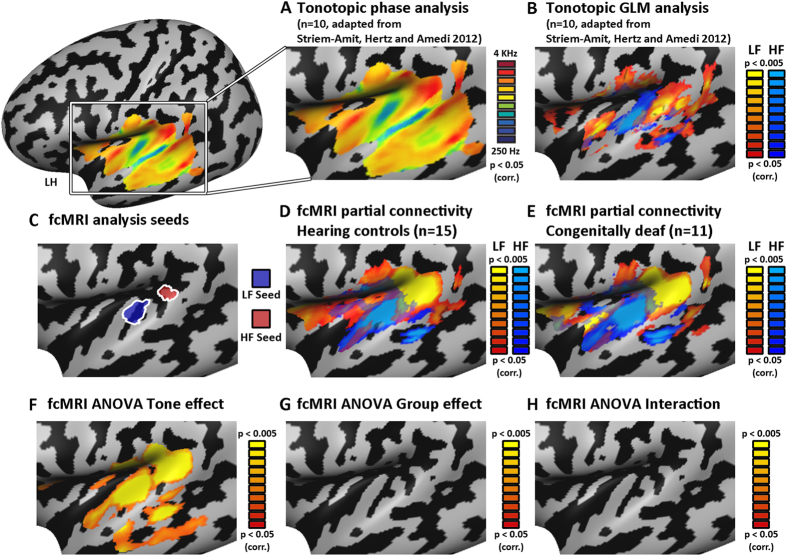
Figure 1. Topographic gradients in fcMRI of the deaf auditory cortex mimic tonotopic organization.
(A) Tonotopic gradients are presented on a left inflated cortical hemisphere, and cover a large extent of the temporal lobe when mapped directly using auditory stimuli analyzed with phase-encoding analyses in normally hearing subjects (adapted with permission from56). (B) Tonotopic peaks are identifiable using a direct binary contrast (HF > LF and vice-versa) in task-based tonotopy experiment. Both the core auditory gradient of HF-LF-HF along the superior temporal plane as well as the belt LF lateral band and STG-STS LF peaks are recognizable in this contrast (see peak marking in Figure S1A,B). (C) For fcMRI analysis, seeds corresponding to high-frequency (HF; marked red) and low-frequency (LF; marked blue) peaks in the core auditory cortex were chosen. These seeds were used in a partial-correlation mapping minimizing the common components between the two seeds, illuminating differential FC preferences for LF- and HF-preferring regions. (D) fcMRI analysis of the hearing control group (random-effect GLM analysis) reveals the topographical organization of functional-connectivity which mimics the tonotopic-organization within the auditory core, belt and beyond. Spatial-similarity-analysis quantitatively supports the significant similarity between the tonotopic-gradients and the FC topographic maps (see results). (E) fcMRI analysis (random-effect GLM analysis) reveals topographical organization in the auditory cortex of the congenitally deaf group, which greatly resembles the tonotopic patterns, extending from the core auditory cortex to speech/voice regions and beyond them. For marking of the comparable peaks between FC and tonotopy and across the groups see Figure S1. A spatial-similarity-analysis quantitatively supports the significant similarity between the tonotopic gradients and the FC topographic maps (see results). This suggests these topographical patterns develop regardless of auditory experience. (F–H) Analysis of variance (ANOVA) of the two groups shows that while most of the auditory cortex of both groups is selective for one seed over the other (F, seed/tone effect; see also MGN; Figure S2), it shows no significant group effect (G) or group X seed interaction (H), suggesting that the FC large-scale topographical patterns are identical across groups. For effects of group and interaction outside the auditory cortex see Figure S8, Tables S1,2.

