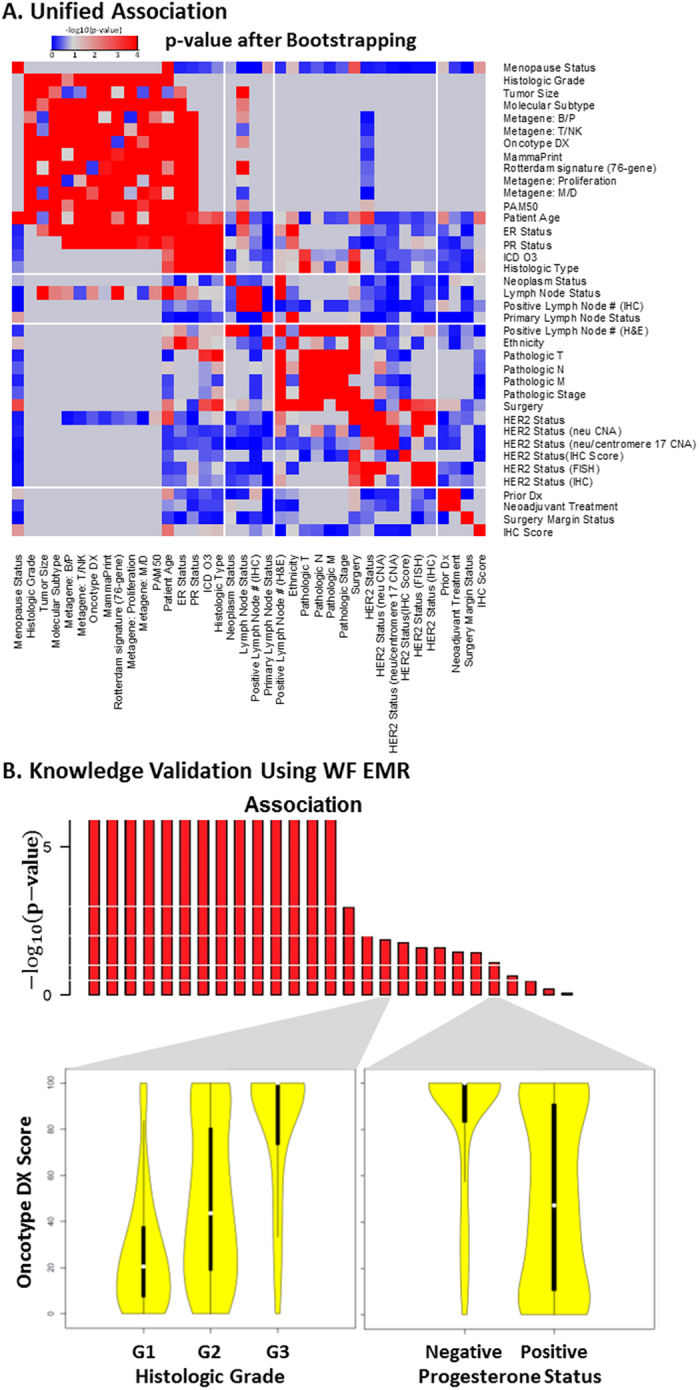
Figure 2. BUFAM feature association discovery.

(A) Overview of the measures of pairwise feature associations presented in  . Gray regions represent non-testable associations. (B) Validation of discovered associations using the EMR of Wake Forest Baptist Medical Center (WakeOne) presented in
  . Associations between Oncotype DX score and histologic grade, and between Oncotype DX score and progesterone status, are shown as examples.
