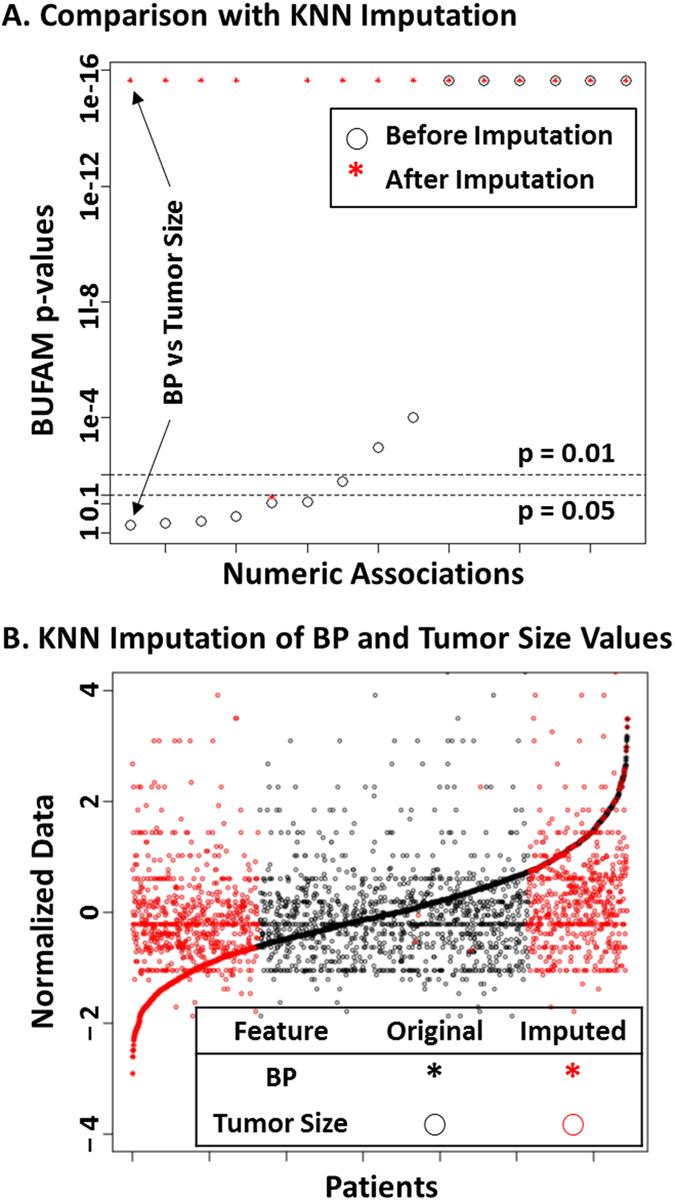
Figure 3. Comparison with KNN algorithm.

(A) Missing values of 6 numeric features were imputed by the KNN algorithm. These were compared with p-values generated by BUFAM for the corresponding 15 pairwise associations before (black circles) and after (red stars) imputation. Associations were sorted according to p-values generated by BUFAM before imputation. (B) Comparisons of normalized original (black) and imputed (red) values of the BP metagene (stars) and tumor size (circles). Patients were sorted according to normalized BP metagene values.
