
Figure 4. Comparison with meta-analysis.
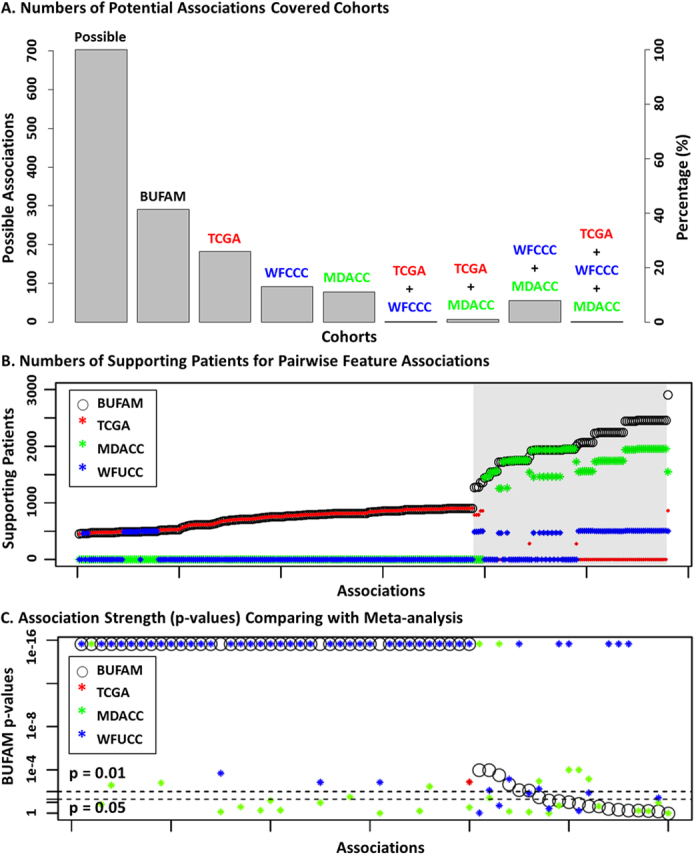
(A) Comparison of feature pairs for BUFAM and cohort-based analyses. (B) Numbers of supporting patients for each pairwise association found with BUFAM compared to meta-analysis. (C) Comparison of association results of BUFAM and meta-analysis were compared. The two horizontal dashed lines marked the p-values of 0.01 and 0.05, respectively. Black: BUFAM; Blue: WFCCC; Green: MDACC; Red: TCGA.