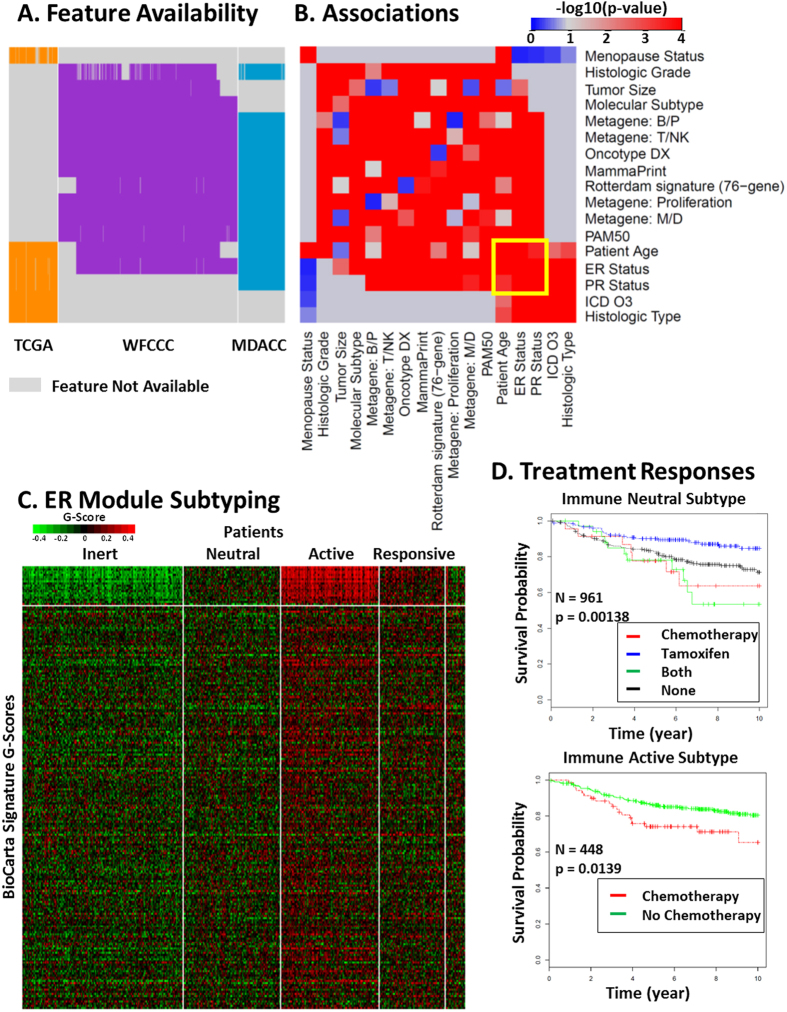
Figure 6. ER module discovery and patient subtyping for drug responses.
(A) Feature availability among the TCGA (orange), WFCCC (purple), and MDACC (blue) cohorts. Feature names are shown at the right. Unavailable features are labeled in gray. (B) Pairwise associations among features in the ER module presented in  . The yellow box highlights common associations shared by two groups of associations. (C) Patient subtyping using the BioCarta signatures (top region) associated with the ER module. These signatures revealed four subtypes: Immune Inert, Neutral, Active, and Responsive. (D) Differential treatment responses assessed by Kaplan-Meier survival analysis of the WFCCC cohort, using distant-metastasis-free survival time as the index. Survival curves of the Immune Neutral (top) and Active (bottom) Subtypes under different treatments are presented and labeled with patient numbers and log-rank test p-values. More details are given in the Supplement.

