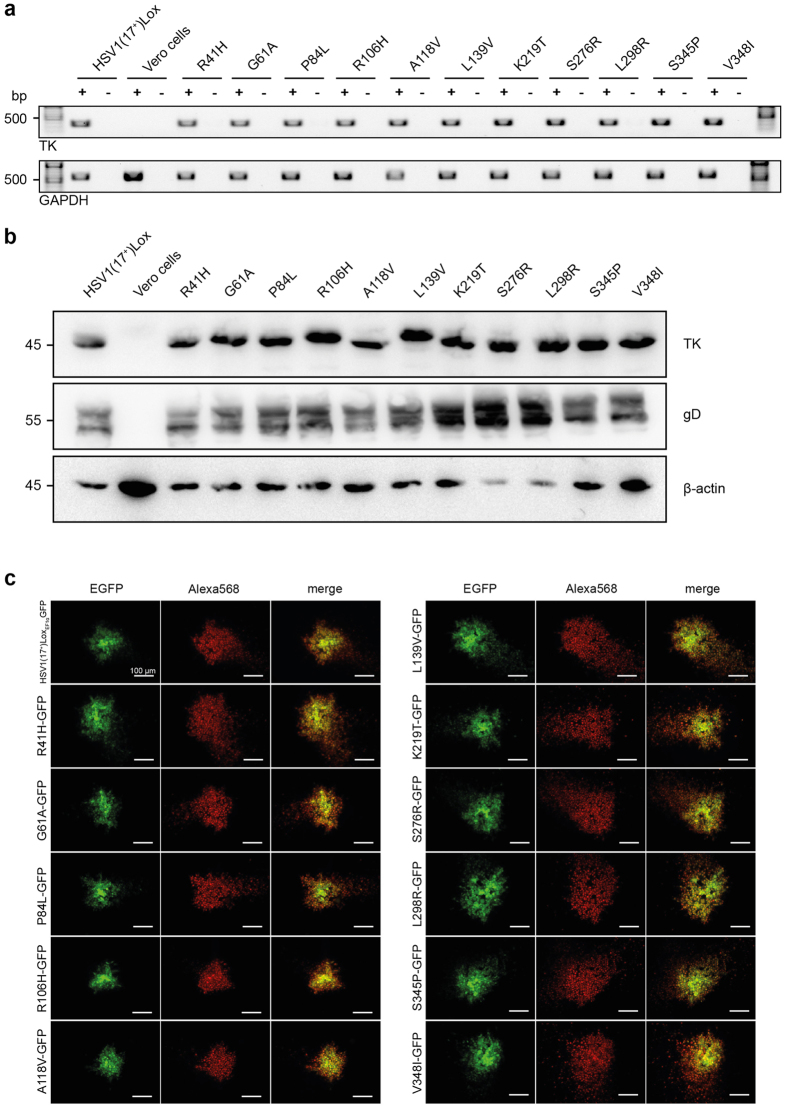
Figure 2. TK gene expression after transfection of Vero cells.
(a) RT-PCR was performed to confirm UL23 gene transcription. The analysis of GAPDH served as cellular control. The PCR was conducted in presence (+) and absence (−) of reverse transcriptase to exclude DNA contamination. (b) Immunoblotting was performed to confirm TK protein expression. The analysis of gD protein served as viral-load control and beta-actin as cellular control. (c) Immunofluorescence microscopy revealed TK protein expression in infected Vero cells. Plaques by EGFP-tagged virus strains (first column) were stained with anti-TK antibody (second column). The third column displays the merged images.

