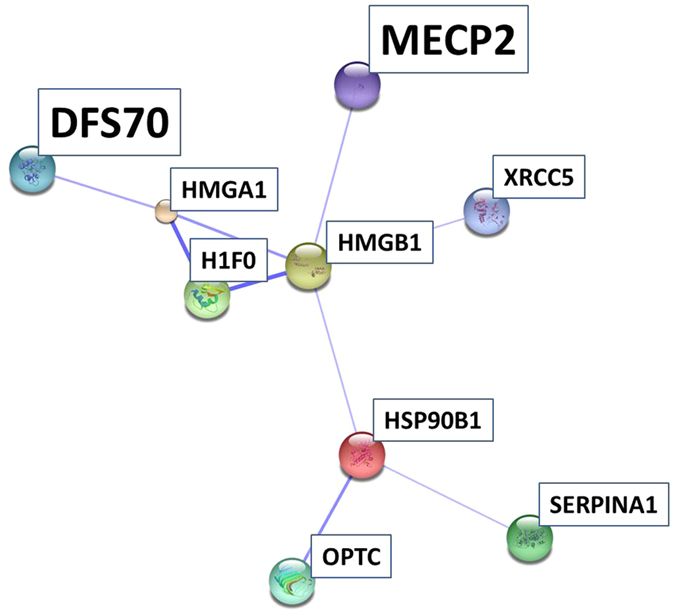
Figure 12. STRING analysis leads to isolation of an interaction network between glaucoma associated candidates.

MECP2 and DFS70 are two highlighted members of the interaction network emphasizing their potential role in the disease.

MECP2 and DFS70 are two highlighted members of the interaction network emphasizing their potential role in the disease.