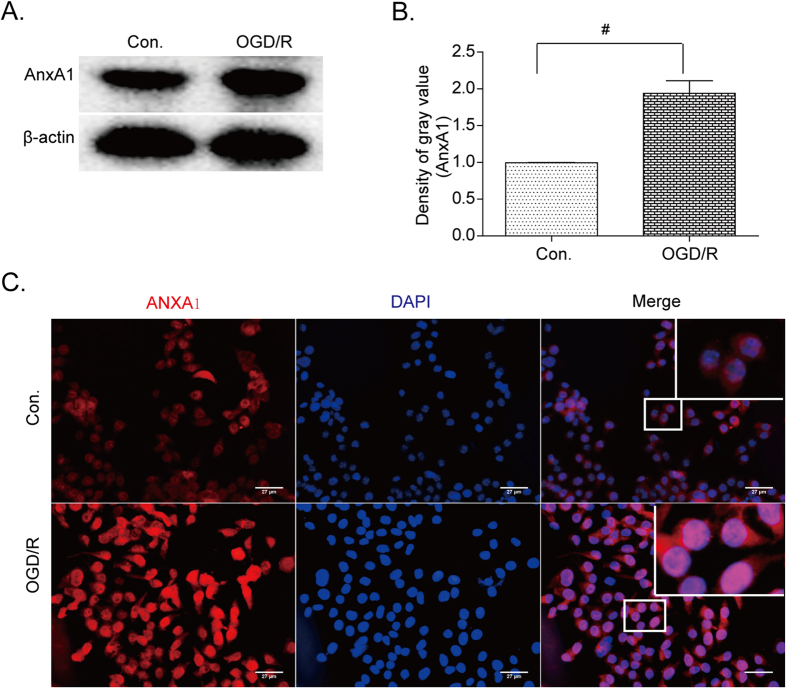
Figure 2. Expression and translocation of ANXA1 after OGD/R treatments.
(A) Western blot analysis showing ANXA1 protein levels in BV-2 microglial cells before and after OGD/R. (B) Western blot intensities were quantified and normalized to their respective controls (defined as 1.0). Data are expressed as mean ± SEM; n = 3; #P < 0.01 versus controls. (C) Immunofluorescence analysis of ANXA1 (red, left panels) in BV-2 microglial cells and in nuclei (blue, middle panels). Merged images are shown in the overlay pictures with partially enlarged details (right panels) in both control (top panels) and OGD/R conditions (bottom panels). Data are representative of three independent experiments. Bar = 27 μm.

