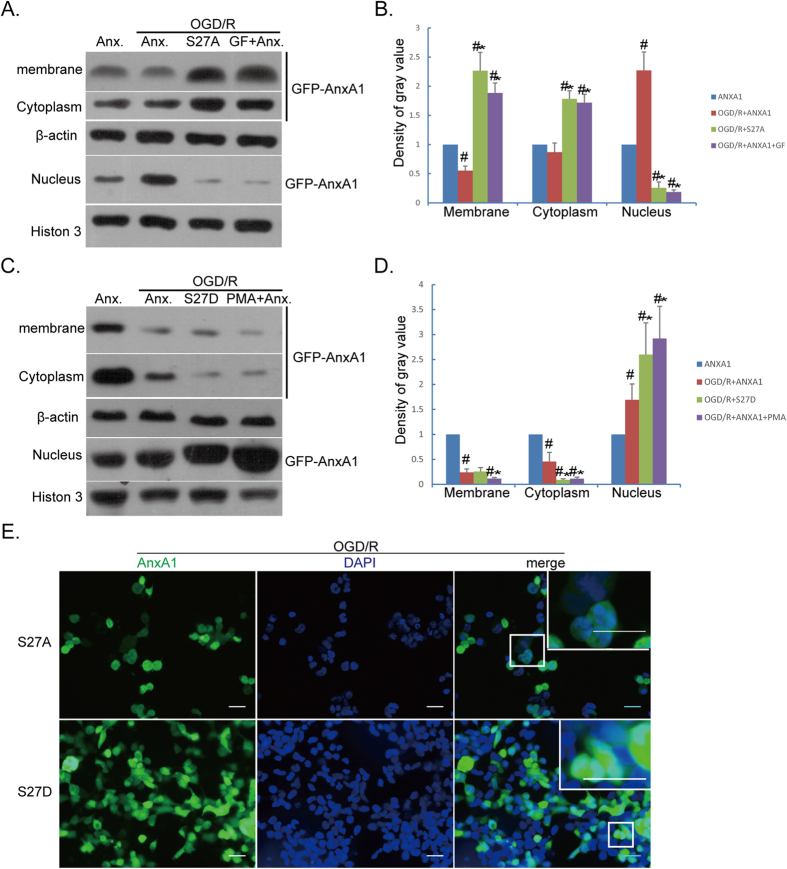
Figure 5. Translocation of ANXA1 after OGD/R injury.
BV-2 microglial cells were transfected with wild-type (WT) ANXA1 or mutated ANXA1-S27A, or WT ANXA1 with addition of the PKC antagonist, GF109203X, (1 μM); or the ANXA1-S27D mutant or WT ANXA1 together with the PKC activator, phorbol ester (PMA, 1 μM). (A) Western blot analysis showing the translocation of ANXA1 in BV-2 microglial cells treated as indicated. The top western blot panel indicates the levels of translocated ANXA1 at the plasma membrane; in the cytoplasm (second panel from top), and in the nucleus (fourth panel from top). (B) Western blots intensities normalized to their respective controls (defined as 1.0). Data are expressed as mean ± SEM; n = 3; #P < 0.05 versus ANXA1. #*P < 0.05 versus ANXA1 + OGD/R. (C) Western blots showing the translocation of ANXA1 in BV-2 microglia cells treated as indicated. Top western blot panel indicates the levels of translocated ANXA1 at the plasma membrane; in the cytoplasm (second panel from top), and in nucleus (fourth panel from top). (D) Western blot intensities normalized to their respective controls (defined as 1.0). Data are expressed as mean ± SEM; n = 3; #P < 0.01 versus ANXA1. #*P < 0.05 versus ANXA1 + OGD/R. (E) Transfected EGFP-tagged ANXA1 constructs into BV-2 microglial cells (in green, left panels), and their nuclei (in blue, middle panels). Merged images are shown in the overlay pictures with partially enlarged details (right panels) for ANXA-S27A (top panels) and ANXA1-S27D (bottom panels). Bar = 20 μm. Data are representative of three independent experiments.

