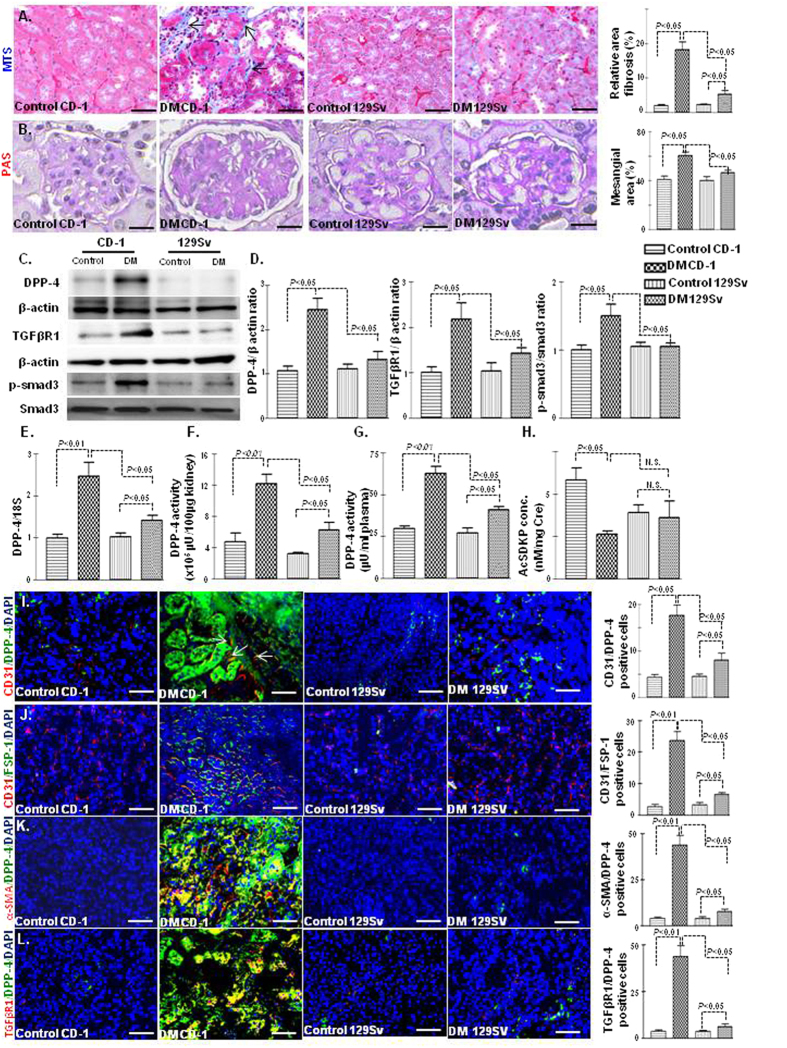
Figure 1. Fibrotic kidneys exhibited the induction of DPP-4 and the suppression of AcSDKP in diabetes.
(A) Masson’s trichrome staining (MTS) in the non-diabetic and diabetic kidneys of CD-1 and 129Sv mice strains and the quantification of the relative area fibrogenesis (RAF). Scale bar: 50 μM. (B) Periodic acid–Schiff (PAS) staining and the quantification of relative mesangial area in glomerular tufts (GSA). Scale bar: 50 μM. (C) Western blot analysis of DPP-4, TGFβR1 and smad3 phosphorylation in the non-diabetic and diabetic kidneys of the CD-1 and 129Sv mice strains. Representatives from 5 blots are shown here. (D) Densitometry analysis of DPP-4, TGFβR1, and smad3 phosphorylation. DPP-4 and TGFβR1 were normalized by β-actin, smad3 phosphorylation was normalized by total-smad3. (E) Gene expression analysis of DPP-4 by qPCR in the non-diabetic and diabetic kidney. N = 4 were analyzed in control group while N = 6 were analyzed in diabetic group in each strain (F) DPP-4 activity analysis in kidney. (G) DPP-4 activity analysis in the plasma. N = 5 were analyzed in each group. (H) AcSDKP concentration in the urine; urine AcSDKP levels were normalized by the urine creatinine level. N = 5 were analyzed in control while N = 6 were analyzed in diabetic group. (I) Immunofluorescence analysis of CD31/DPP-4 in the kidneys of the non-diabetic and diabetic mice of CD-1 and 129Sv strains. Scale bar: 50 μM. (J) Immunofluorescence analysis of CD31/FSP-1 in the kidneys of the non-diabetic and diabetic 129Sv mice. CD31 red-rhodamin, FSP-1 green-FITC. Scale bar: 50 μM in. (K) Immunofluorescence analysis of α-SMA/DPP-4 in the kidneys of the non-diabetic and diabetic mice of CD-1 and 129Sv mice strains. α-SMA red-rhodamin, DPP-4 green-FITC. Scale bar: 50 μM. (L) Immunofluorescence analysis of TGFβR1/DPP-4 in the kidneys of the non-diabetic and diabetic mice of CD-1 and 129Sv mice strains. TGFβR1 red-rhodamin, DPP-4 green-FITC. Scale bar: 50 μM. Merged pictures are shown. N = 5 were analyzed in each data set. The data are expressed as the means ± s.e.m and are included in the graph. The diabetic mice are designated as DM in the figure.

