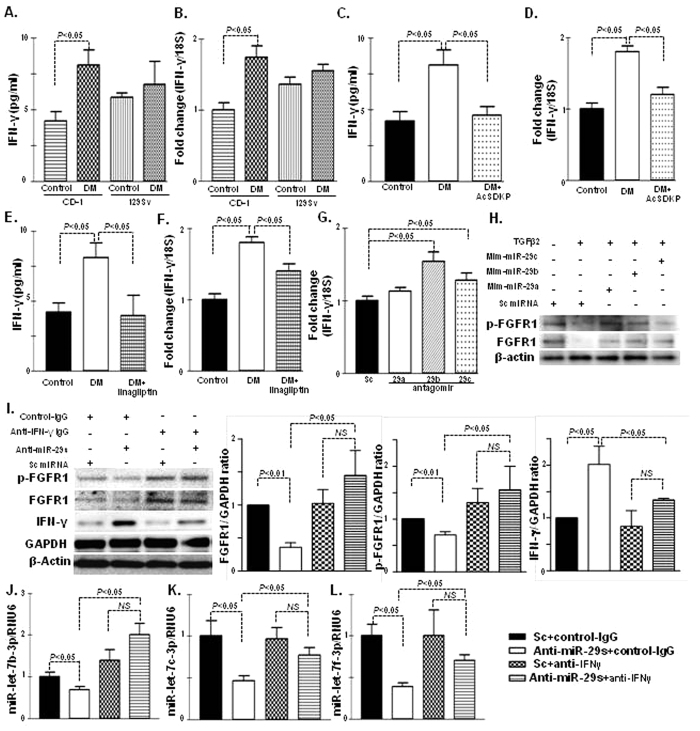
Figure 6. Suppression of IFN-γ and upregulated level of FGF1-phosphorylation by AcSDKP mediates crosstalk bidirectional regulation of miR-29s and miR-let-7s.
(A) IFN-γ level determination in the control and DM of CD-1 and 129Sv mice strains, n = 5 were analyzed in each data set. (B) Gene expression of IFN-γ mRNA expression level in kidney of the control and DM of the CD-1 and 129Sv strains, n = 4 were analyzed in each data set. (C) IFN-γ level in the plasma of control, DM and AcSDKP-treated diabetic mice, n = 5 were analyzed in each data set. (D) qPCR analysis of IFN-γ mRNA gene expression in the kidneys of the control, DM and AcSDKP-treated diabetic kidney, n = 5 were analyzed in each data set. (E) IFN-γ level in the plasma of control, DM and linagliptin treated diabetic mice, n = 5 were analyzed in each data set. (F) qPCR analysis of IFN-γ mRNA gene expression in the kidneys of the control, DM and linagliptin-treated diabetic kidneys, n = 6 were analyzed in each data set. (G) qPCR gene expression analysis of IFN-γ mRNA level in the HMVECs transfected with antagomirs of miR-29s, n = 6 were analyzed in each data set. (H) Western blot analysis of the mimic treatment of miR-29s in the HMVECs. Representatives from 5 blots are shown here. (I) Western blot analysis of the antagomir treatment of miR-29s in the HMVECs, with or without neutralizing antibody for IFN-γ antibody and quantification of densitometric analysis. Representative from 5 blots are shown here. (J–L) qPCR analysis of miR-let-7s after transfection of the antagomir treatment of miR-29s in the HMVECs, with or without neutralizing IFN-γ antibody, n = 6 were analyzed in each data set. Hs_RNU6 was used as internal control. The data are expressed as the means ± s.e.m and are included in the graph.

