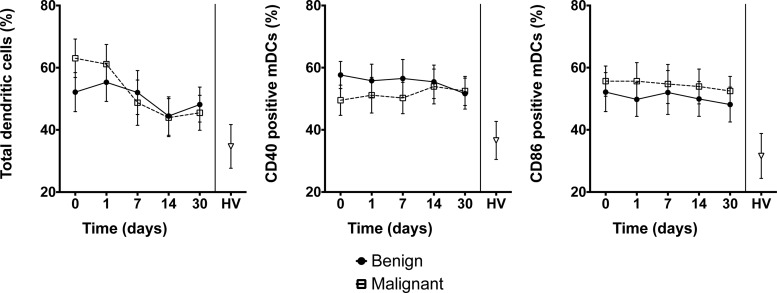
Figure 3. Dendritic cells and co-stimulatory molecules.
Number of DCs (left) and expression of co-stimulatory molecules CD40 (centre) and CD86 (right) in blood samples from patients with OJ. DCs were selected by flow cytometry using a gate based on HLA-DR+Lin1−. The mDC population was then selected from a gate demonstrating CD11c+CD1c+. The co-stimulatory molecules CD40 and CD86 were both selected using the gates SSC+CD40+ and SSC+CD86+ respectively. Values presented are mean (S.E.M.). HV: healthy volunteers. P>0.05 (repeated measures ANOVA) for comparison of patients with benign compared with malignant biliary obstruction. P<0.05 for comparison of healthy volunteers compared with patients with OJ.

