
Figure 2.
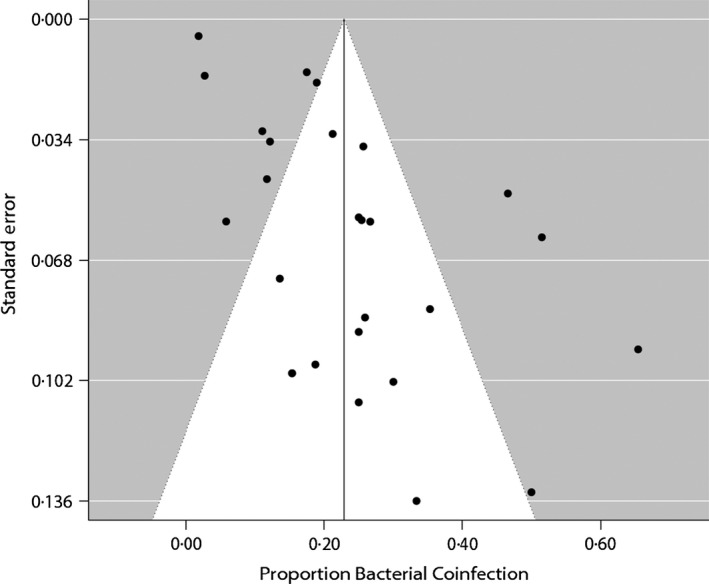
Funnel plot of each study's standard error (y‐axis) against each study's frequency of bacterial coinfection in laboratory confirmed hospitalized patients. Because small studies have less precision and large studies have more, scatter should form an inverted funnel when there are no systematic missing studies. The line indicates the overall mean frequency of coinfection (23%). The funnel plot appears asymmetric. Egger's test of asymmetry was significant for bias (P = 0·0004).