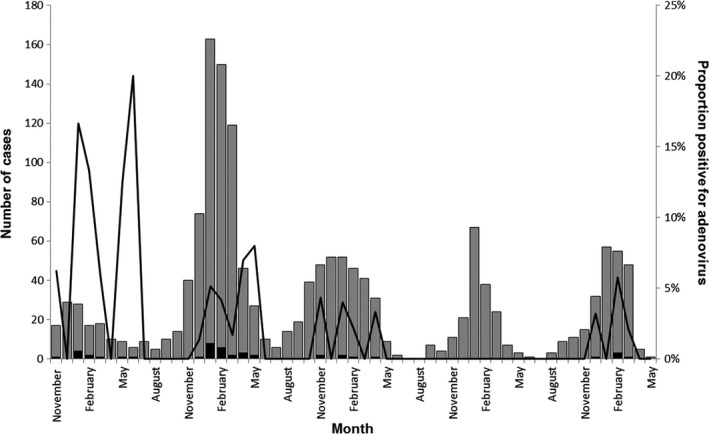
Figure 1.

Distribution of adenovirus‐positive cases among patients with influenza‐like illness, by month and year. Gray bars represent the total number of cases of influenza‐like illness. Black bars represent the number of adenovirus‐positive cases. Black indicates the proportion of cases positive for adenovirus.
