
Figure 5.
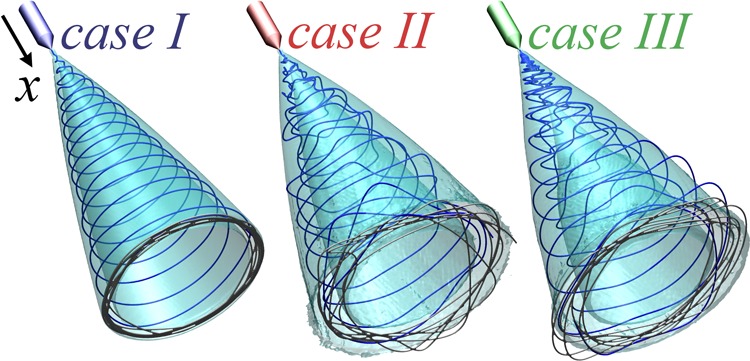
Simulation snapshots of the three different cases. From left to right the snapshots correspond to case I, vflow = 0 m/s, case II, vflow = −10 m/s, and case III, vflow = −20 m/s, respectively. The jet between the nozzle and the collector is drawn in blue, and the fibers deposited on the collector are gray. The isosurfaces in cyan represent the normalized numerical density field ρ̃ of constant value equal to 0.001.