
Figure 8.
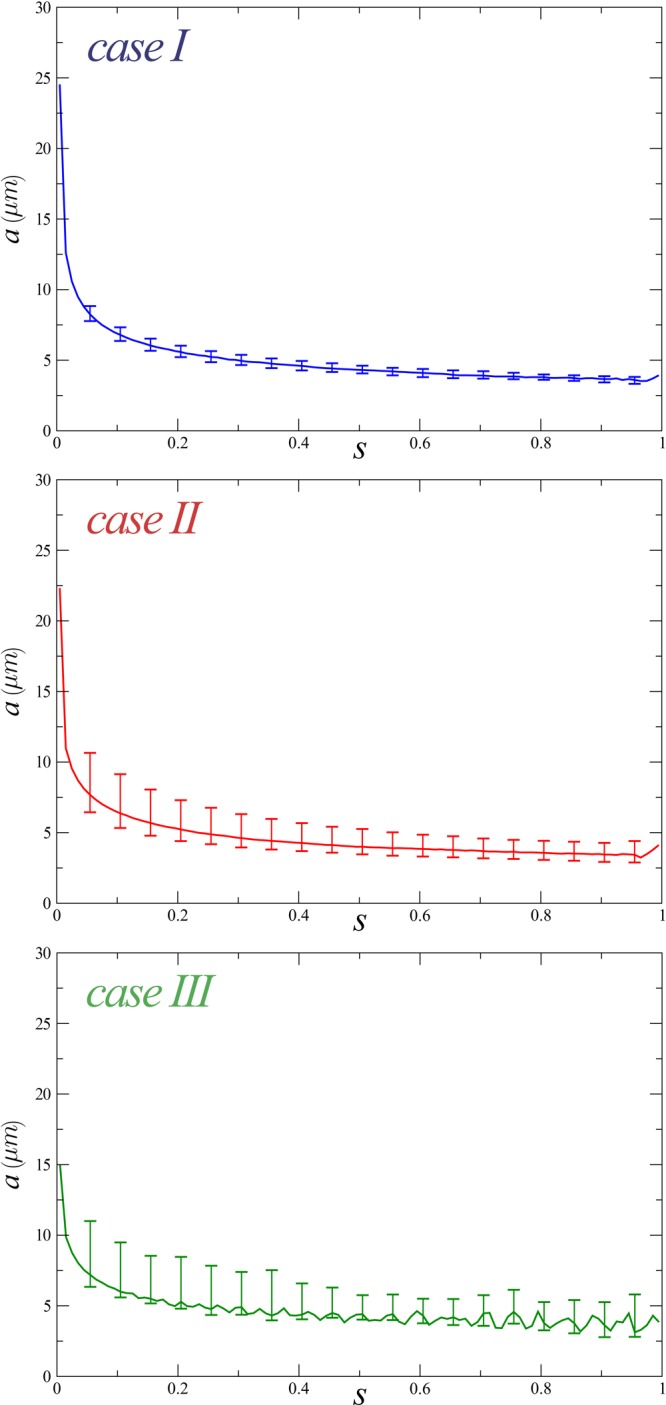
Meadian values of the jet radius distributions, a (micrometer), computed along the curvilinear coordinate s for all the three cases. The error bars provide the amplitudes of the distributions evaluated as interquartile range.
Official websites use .gov
A
.gov website belongs to an official
government organization in the United States.
Secure .gov websites use HTTPS
A lock (
) or https:// means you've safely
connected to the .gov website. Share sensitive
information only on official, secure websites.
Meadian values of the jet radius distributions, a (micrometer), computed along the curvilinear coordinate s for all the three cases. The error bars provide the amplitudes of the distributions evaluated as interquartile range.